
|
Home
| pfodApps/pfodDevices
| WebStringTemplates
| Java/J2EE
| Unix
| Torches
| Superannuation
| CRPS Treatment
|
| About
Us
|
|
|
Flexible Plotting with pfodWeb
|
by Matthew Ford 26th June 2026 (originally posted 16th March
2026)
© Forward Computing and Control Pty. Ltd. NSW
Australia
All rights reserved.
Update 26th June 2026 – The latest version of pfodWeb can mouse over data values and has slightly different controls. See pfodWeb — Chart Mode User Guide for the latest details
The tutorial
covers how to plot CSV data, coming from your micro, in a web browser
using pfodWeb Charting. You can connect pfodWeb to your micro via
Serial, BLE or HTTP.
pfodWeb is part of the pfodParser Arduino
library. Detailed code examples are provided here for Pi Pico W / 2W
connecting via Serial, BLE and HTTP. The pfodParser library also
provides examples for ESP32 and ESP8266
pfodApp
has been in development for 15 years.
First as a J2ME application and since 2012 as an paid Android
app.
pfodWeb, provides
a browser based javascript version of pfodApp that can be run on any
modern computer or mobile (including Apple IPhones)
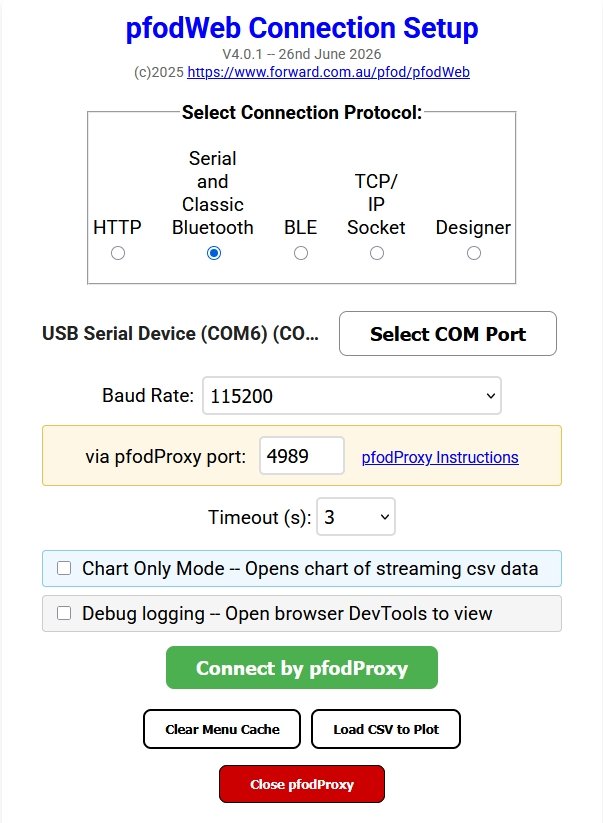
A single web page, pfodWeb.html, handles all four connection types, HTTP and via pfodProxy, Serial, BLE and TCP/IP
No external connections or downloads needed.
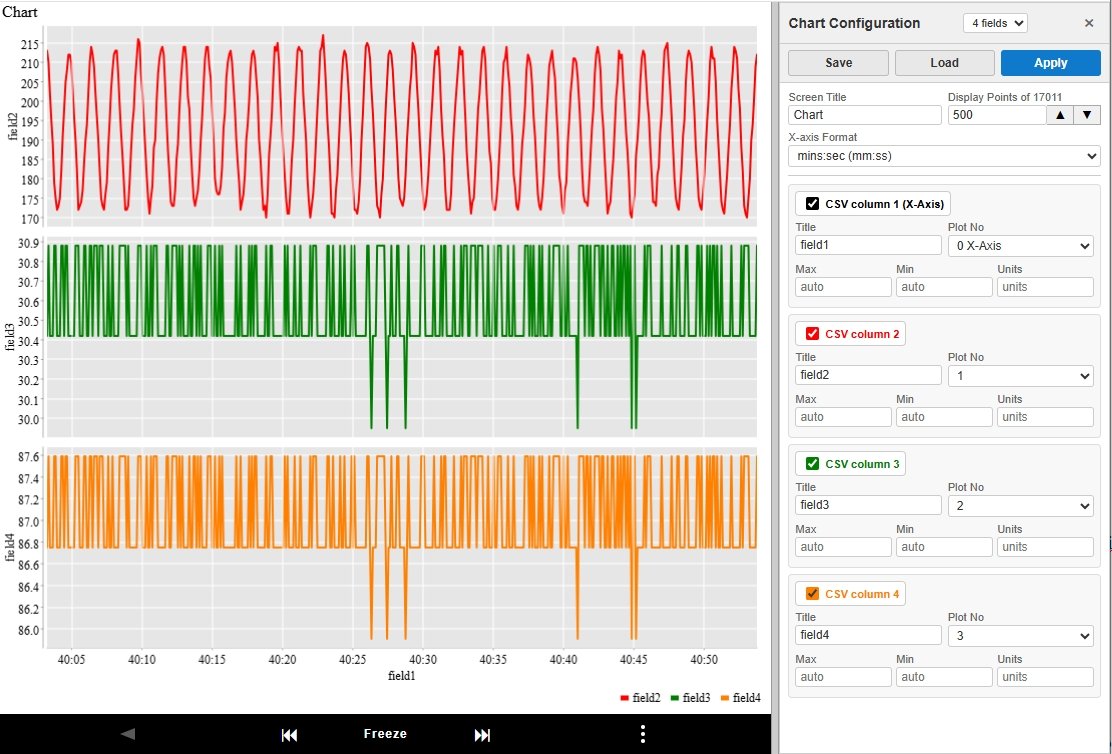
Any numeric CSV data can be plotted. Any field (or none) can be set as the X-axis. The X-axis can be formatted as Time mins:secs etc.
Mouse over chart to read data point values.
Fields can be displayed on individual plots or grouped as appropriate.
The Chart Configuration can be saved and reloaded.
Streaming live data is viewed in a window of adjustable number of data points
When the view is frozen you can zoom in.
You can bookmark a url that contains the connection type and chart configuration for quick re-runs.
You can export the CSV data and reload into pfodWeb later for reviewing. Actually any CSV file can be loaded not just ones pfodWeb saved.
Your micro can send, intermixed, multiple data streams which pfodWeb can switch between.
If connecting via HTTP you can optionally serve pfodWeb.html from your micro for a complete stand alone implementation
Quick Overview
of pfodWeb and pfodWebDesigner
Parts
List
pfodWeb Charting via Serial
Saving
and Loading the Chart Configuration
Handling
Multiple Data Streams
pfodWeb Charting via
BLE
pfodWeb Charting via HTTP
Serving
pfodWeb.html from your microprocessor.
Compatible
Web Browsers for Serial and BLE connections via pfodWeb
How
Safe is the pfodWeb
Conclusion
pfodApp
has
been in development for over 25 years. First as a J2ME application
and since 2012 as an paid Android app.
pfodWeb,
provides a browser based, javascript, version of pfodApp that can be
run on any modern computer or mobile (including Apple IPhones)
pfodWeb is a free web based, partial replacement, for the paid Android app, pfodApp. pfodWeb runs in a browser and connects to your Arduino board via either Serial or BLE or HTTP. Using Serial you can connect to any Arduino board and display the interactive controls that board serves. pfodWeb runs competely off-line. No internet connection is needed. Just install the pfodParser library and open the index.html in the pfodWeb sub-directory of the pfodParser library. The interactive controls are completely defined by the code (generated by pfodWebDesigner) in your Arduino. Very compact pfod messages are used to send the controls and receive the user's commands.
Just install the Arduino pfodParser library (or download pfodParser.zip). Go to the libraries sub-directory for your OS .../libraries/pfodParser/pfodWeb/windows , macOS, or linux dir, run the pfodProxy. (See pfodWeb_startup)
If your Arduino board supports HTTP and has a file system of 1Mb, then you can load the pfodWeb.html files onto your microprocessor and serve them directly from there.
Pi
PicoW US$4.95 or Pi
Pico2W US$7.00 or other Arduino board
Pi
Pico board support V5.5.1 or other board support as needed for
your board
Arduino
IDE V2 (V2.3.8)
data upload add-on arduino-littlefs-upload
if
serving pfodWeb from your microprocessor via HTTP
pfodParser
(V4.1.2+) and SafeString
libraries from the Arduino library manager.
Here the Arduino IDE is used to code the Pi Pico W / 2W, but any micro that supports writing to a Serial connection could be used.
Install Arduino IDE V2 – For Windows, use the "Windows ZIP" or plain "Windows" executable (EXE) downloaded direct from https://arduino.cc. and allow it to install any device drivers it suggests.
Add the Pi Pico board support V5.5.1 to the Arduino IDE.
Install the latest pfodParser library from the library
manager. Install the latest
SafeString library from the library manager
See
pfodWeb-guide.html
and pfodWeb-chart-mode-guide.html
in the documentation
sub-directory of the pfodParser
library for a quick over view of pfodWeb and pfodWeb charting.
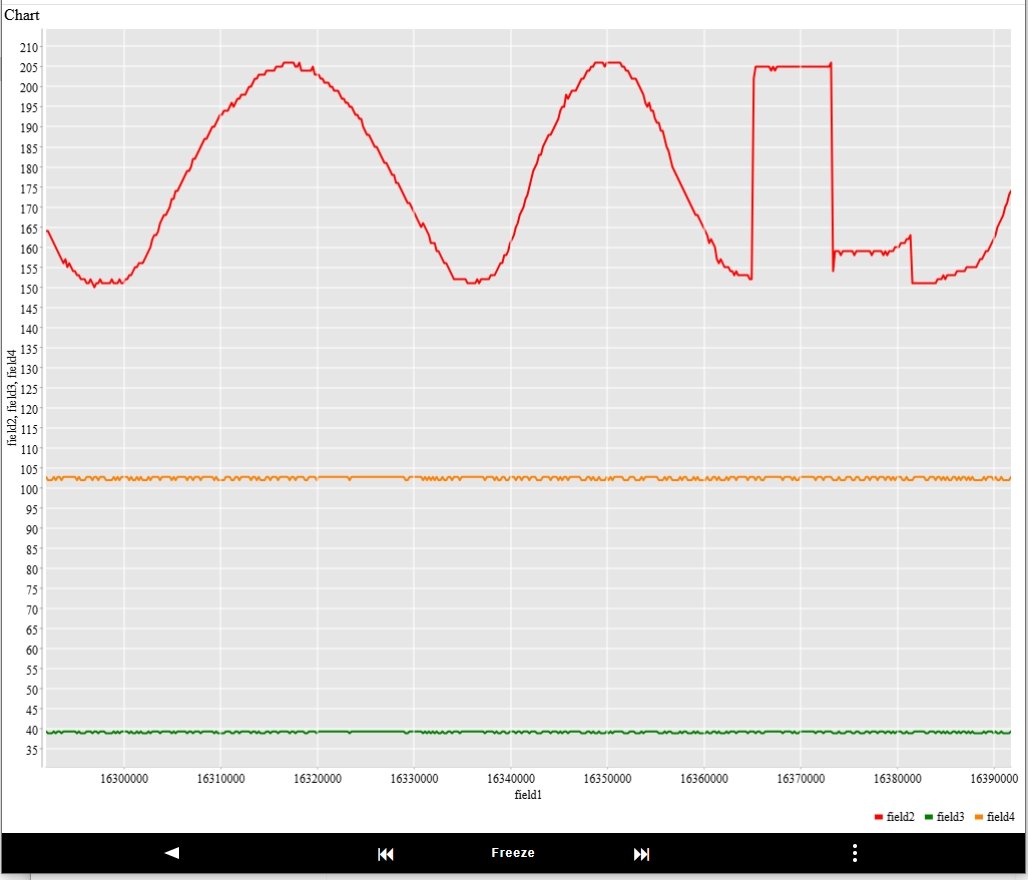
Plug in the Pi Pico and open the pi_picoCharting_serial.ino and upload it. This sketch sends a CSV line of milliseconds since reboot, ADC reading, Chip Temp in ℃, Chip Temp in ℉ every 200ms
From the pfodParser library, in sub-directory pfodWeb, and
run the pfodProxy. pfodWeb.html opens in your default browser.
Select Serial and select the Pi Pico serial connection,
Tick
Chart Only Mode <<< Very Important this skips the normal
pfod request for the main menu
Then click Connect by
pfodProxy.
Note: This will fail if the Arduino IDE or other
application already has that port open. Close the Arduino Serial
Monitor.
NOTE: The latest version of pfodWeb has slightly different controls. See pfodWeb — Chart Mode User Guide for the latest details
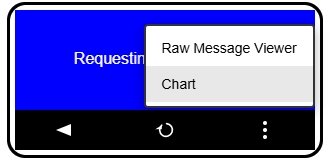
By default the first field is used as the X-Axis. Use the … menu button open the Raw Message Viewer.
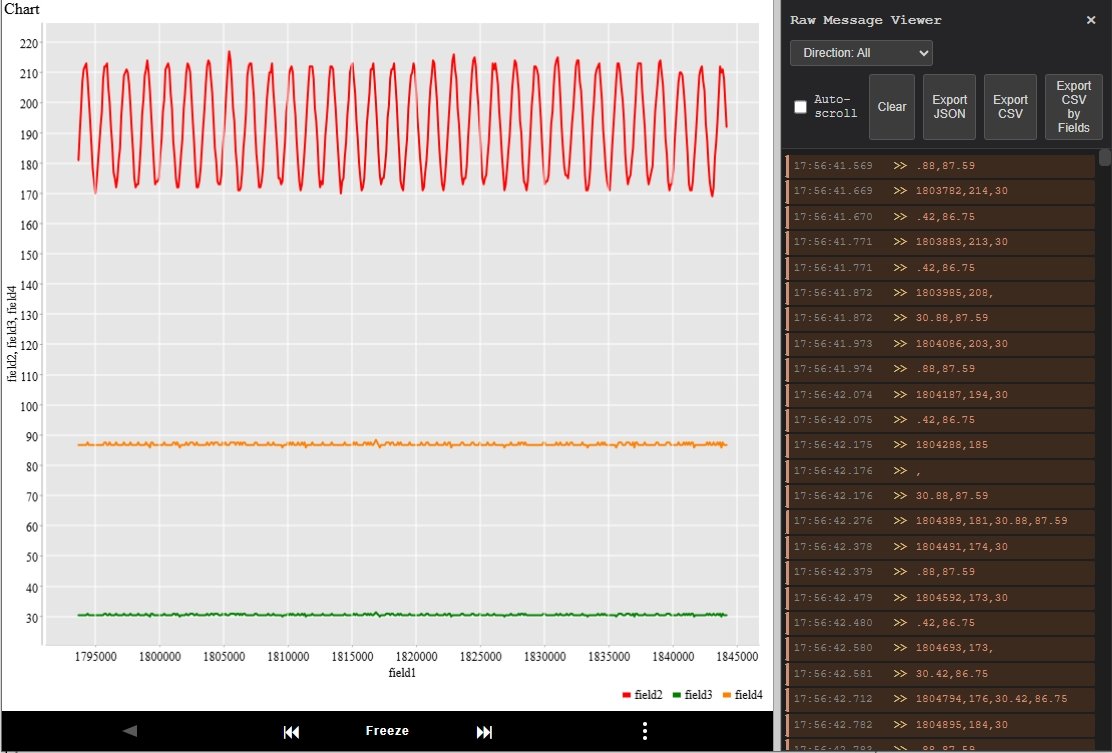
From there you can export the CSV data by fields for later
reloading and analysis.
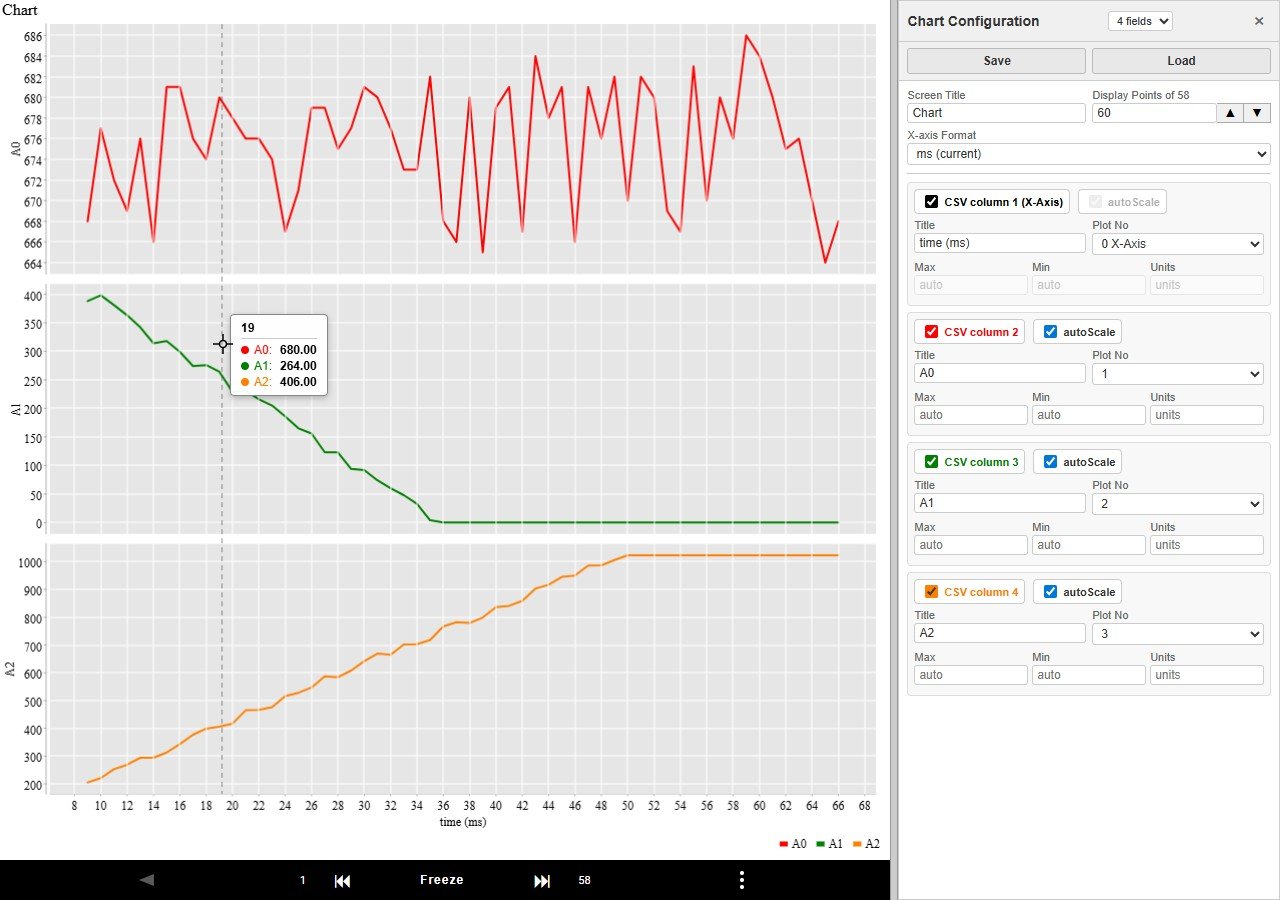
Use the … menu to open the Chart Configuration.
Hint you can Load the Pi_Pico_ADC_and_Temp.4fields file to set the complete chart configuration
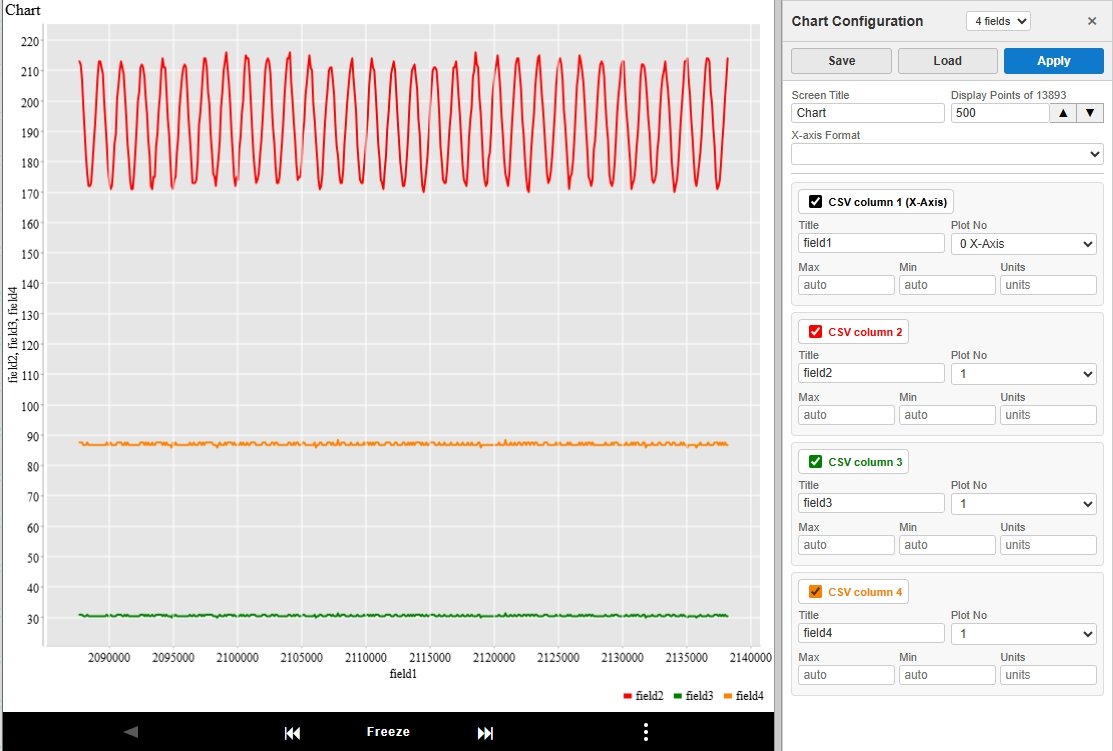
By default all fields are on the same plot (Plot No 1) and there
is not particular X-axis Format. Put each field on separate plots, 1,
2, 3 and select mins:sec format for the X-axis and the click
Apply
You can remove a
field from the chart by un-ticking that CSV column
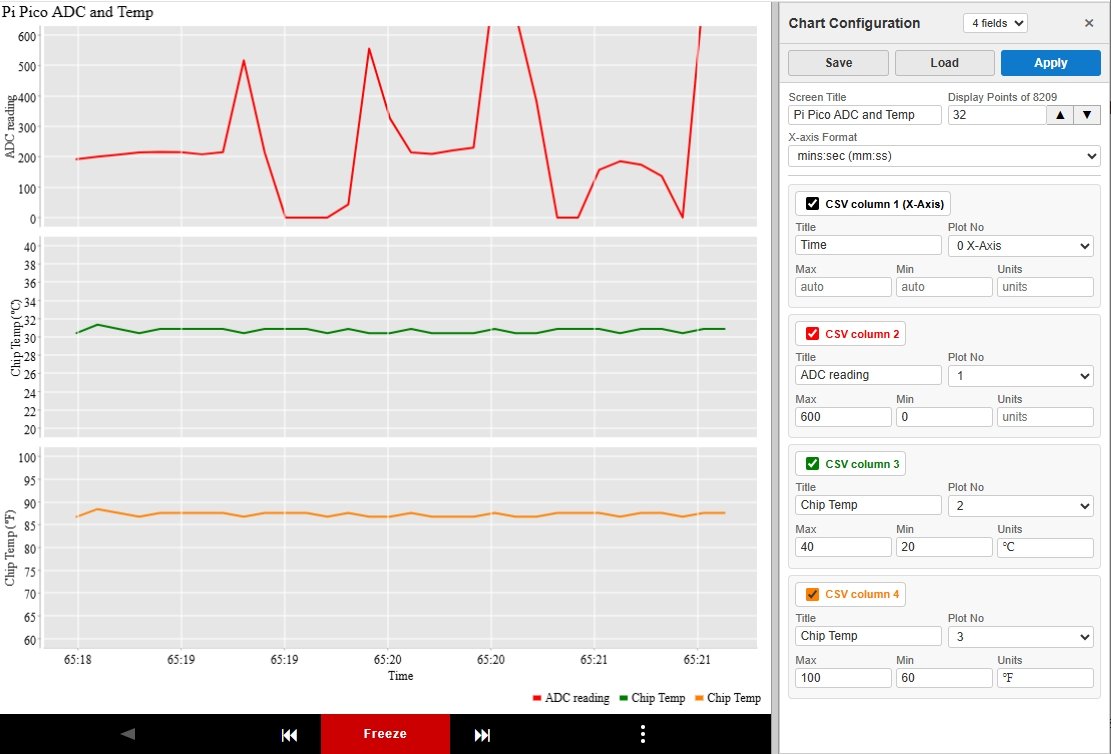
Set appropriate max / min values and units and Titles for each plot e.g. (Saved in Pi_Pico_ADC_and_Temp.4fields )
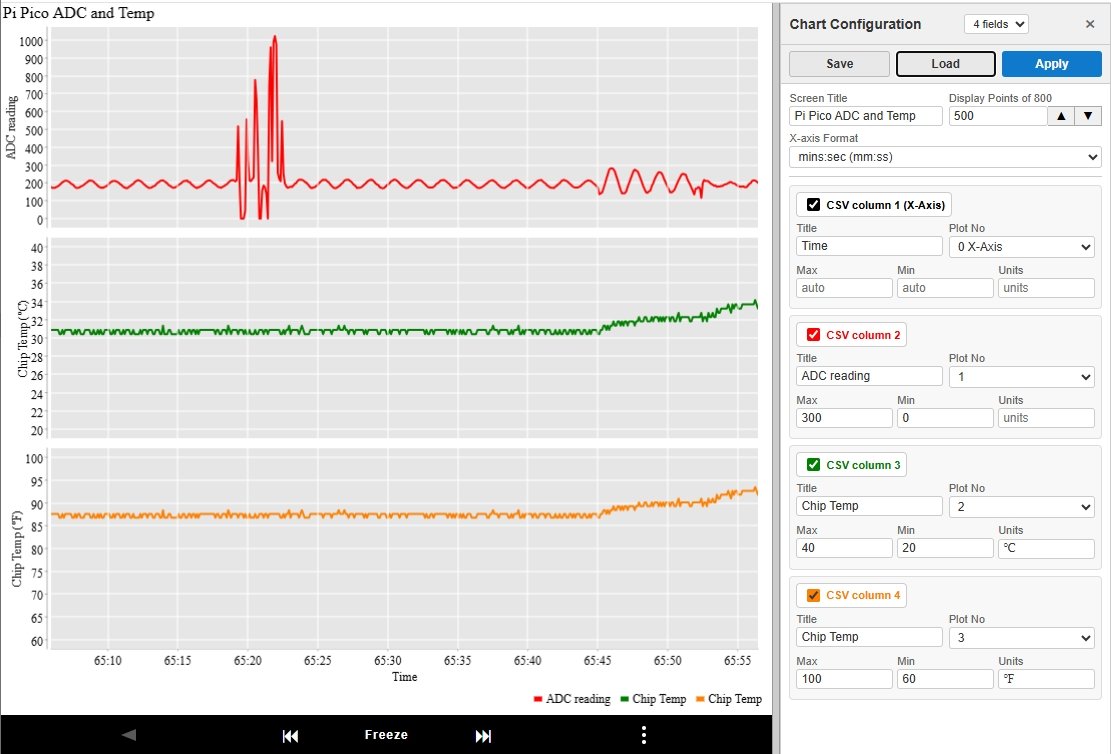
Note that the ADC Reading max
is set to 300, but the data exceeds that and while the chart is
scrolling the scale will always expand to make all the data visible.
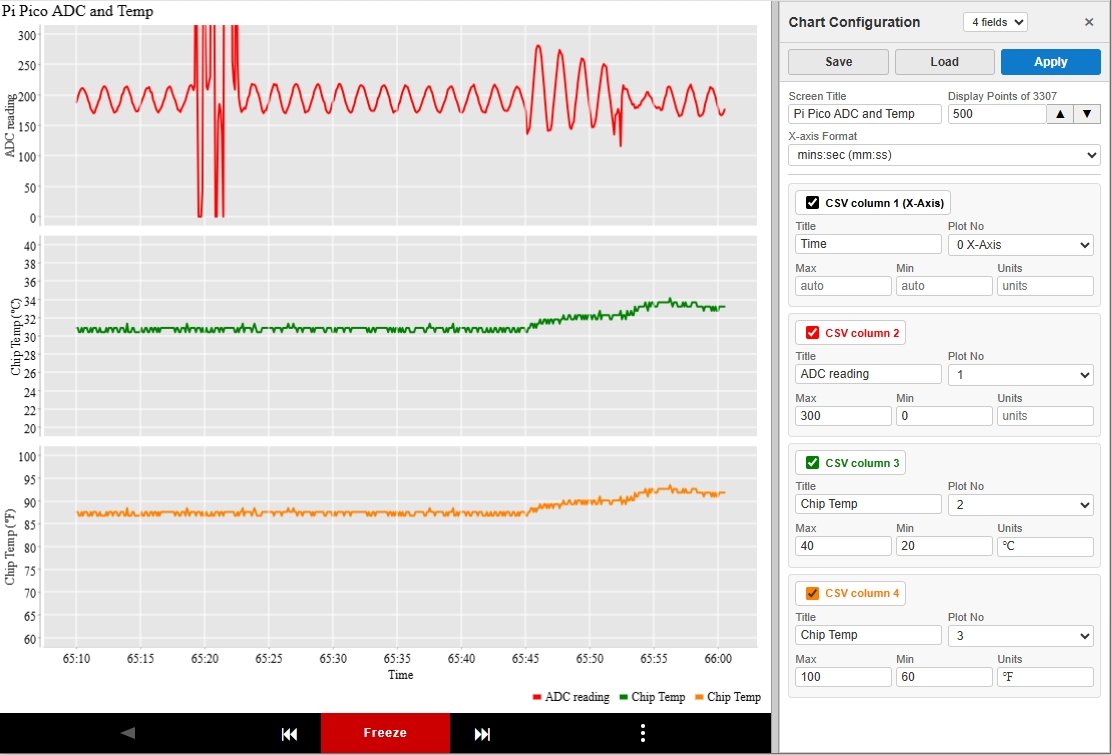
Freezing the Chart stops it
scrolling and
strictly scales to the set max and min values.
You can now use the up/down arrows of Display Points to
double/half the number of points displayed and the left / right
arrows either side of Freeze to move the plot.
This lets you zoom
in the x-axis to the area of interest. Changing the max/min and
clicking Apply zooms
in the y-axis
Here is the ADC readings zoomed in to display just 32 point and with the scale set to max 500 / min 0
Data continues to be accumulated when the chart is frozen so when you un-Freeze the Chart goes back to showing the latest live scrolling data
Once you have configured the Chart the way you want, you can use the Save button to downloaded the config. Load will reload it. The above chart configuration is saved in Pi_Pico_ADC_and_Temp.4fields Loading that file in Chart Configuration will format the chart as above.
But more conveniently you can just bookmark the current URL which contains all the connection details and the chart configuration. Then next time just open that bookmark and connect to start live plotting of the data stream using your preferred chart options.
To re-examine previously saved data, you can also choose Load CSV to Plot and then select the .csv file to chart. If the number of fields in the .csv does not match the bookmarked chart configuration, then the chart will be blank. Use the drop down fields list to the right of Chart Configuration to select the number of csv fields/line to plot.
You can use the Load CSV to Plot button to reload a previously saved Export CSV by Fields (button in Raw Message Viewer) file. E.g. pfod-csv-4fields-2026-03-09T07-53-05.821Z.csv
You can send multiple data streams interleaved. Each line of .csv data with different number of fields is stored separately. By default the data with the largest number of fields will be plotting in the chart, but you can select other data streams from the fields drop down list to the right of Chart Configuration
While Serial connections are the simplest and most universal means of plotting measurement data, you can also plot data remotely via BLE or HTTP, if your microprocessor supports these connections. This section covers plotting the previous data stream via BLE from a Pi Pico W / 2W.
There is no defined BLE standard for serial connection (a gross oversight), but the Nordic UART BLE service is a widely used service that sends and receives unstructured byte data. pfodWeb can connect to BLE devices that advertise the Nordic UART service. The Pi Pico board support V5.5.1 includes support for a Nordic UART service.
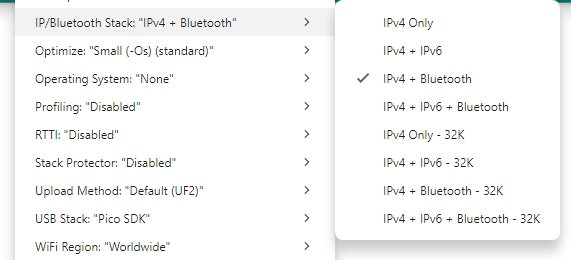
Before compiling BLE sketches for Pi Pico W / 2W you need to enable the BLE stack under the tools menu
Then open the pi_picoCharting_BLE.ino sketch and upload it to your Pi Pico W or 2W
Run pfodProxy, to open pfodWeb.html in your default browser and select BLE and Chart Only
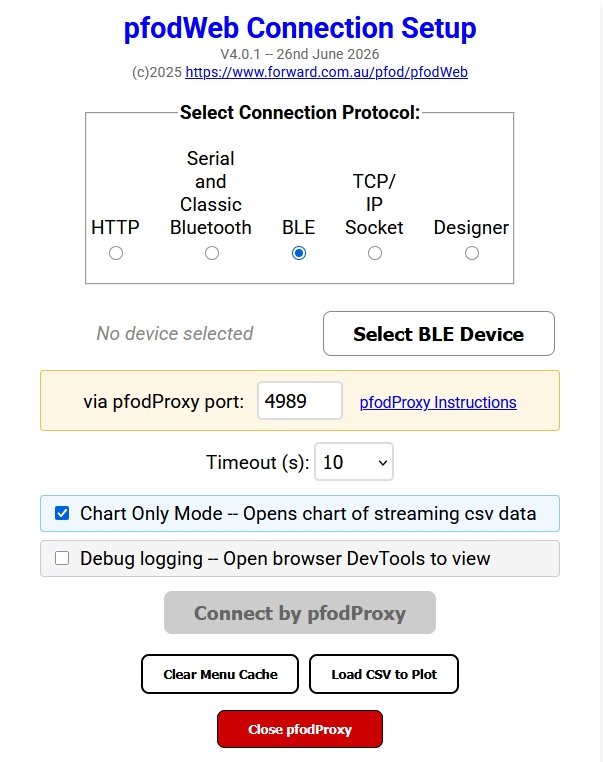
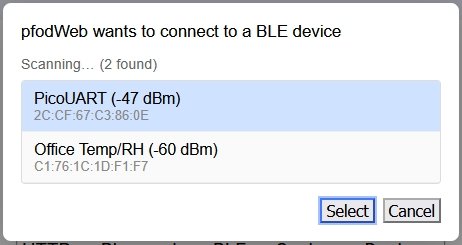
Click Select BLE Device, choose PicoUART
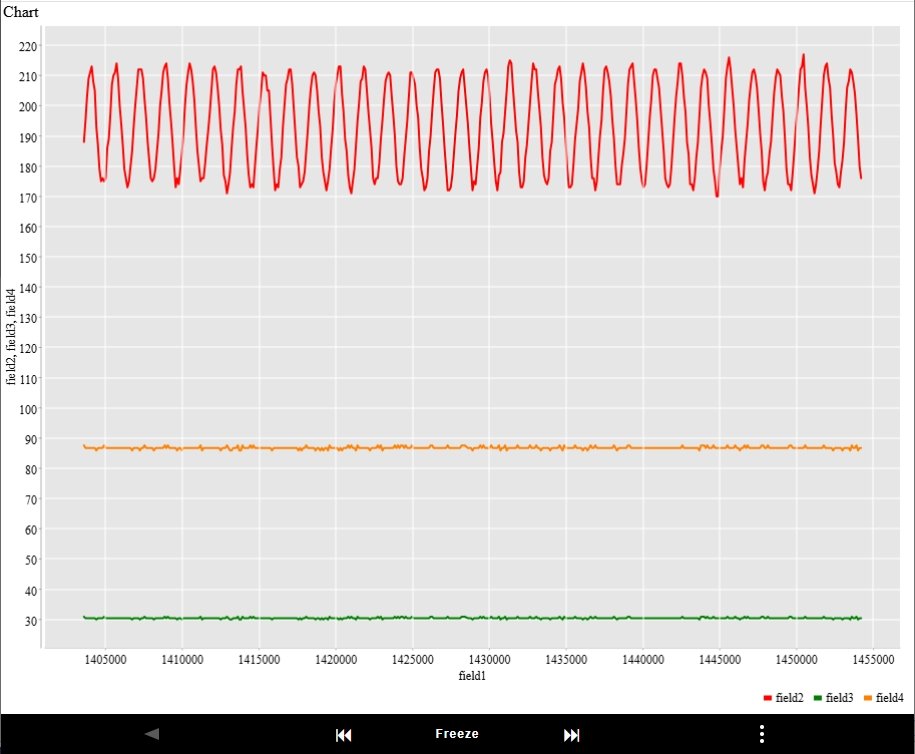
Then click Connect by pfodProxy. That will open a similar default chart as was shown above in the Serial connection.
Connecting via HTTP requires more code in the microprocessor. The Pi Pico W / 2W has to run an HTTP server that handles CORS (Cross-Origin Resource Sharing) requests so that the pfodWeb.html loaded from a file on your computer can access resources from the microprocessor. Charting via HTTP uses polling to pickup the latest data. In between polls (about 1 per sec), the plot data is save in a line based circular buffer (default size 4096 chars). When the buffer fills, old data is discarded a whole line at a time.
pi_picoCharting_HTTP.ino is the sketch. Edit the ssid and password to suit your network and set a suitable IP address. If you leave the IP blank, check the Serial output to see what IP was assigned to your Pi Pico.
Open pfodWeb.html. pfodProxy does not need to be running for HTTP
connection.
Select HTTP and set the IP of your board and click
Chart Only and click Connect
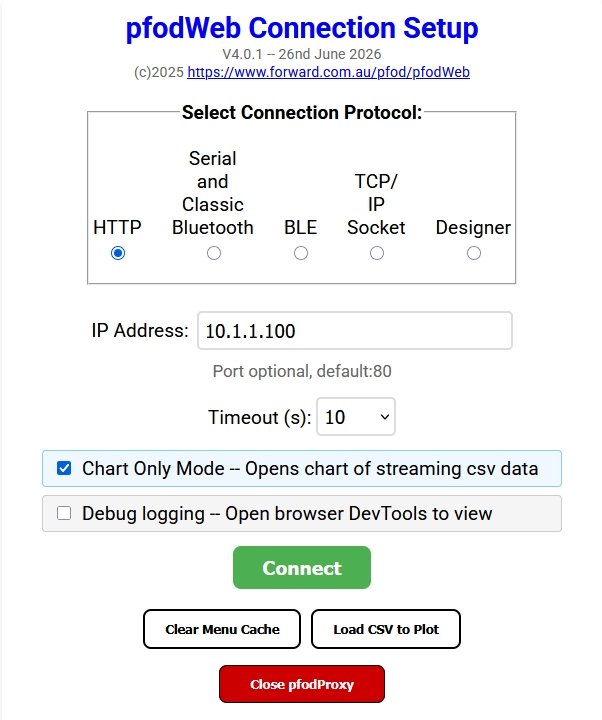
That will open the Chart mode and start plotting the streaming csv plot data. Open the Chart Configuration and load the previously saved chart config, Pi_Pico_ADC_and_Temp.4fields This updates the URL which you can now bookmark to enable a quick re-connect with the current chart format, next time.
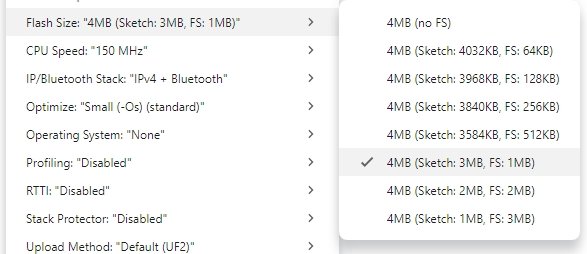
If you can allocate 512KB of LittleFS space on your Pi Pico, you can load pfodWeb.html and all its support .js files into your microprocessor, so that you don't need to have pfodWeb on the device you are connecting from.
From the Arduino IDE tools menu, select a Flash Size that includes at least 1MB of FS.
Unzip the pi_picoCharting_Server.zip
to your Arduino Sketch directory.
Edit the ssid and password to
suit your network and set a suitable IP address. If you leave the IP
blank, check the Serial output to see what IP was assigned to your Pi
Pico.
Then compile and upload the pi_picoCharting_Server.ino
sketch.
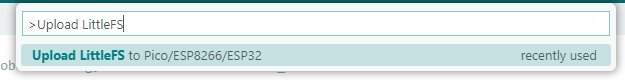
Finally upload the contents of data sub-directory using
the Upload LittleFS to Pico/ESP8266/ESP32 tool. Press
Ctrl+Shift+P to open the extra commands menu and type in
Upload LittleFS to search for the upload tool.
You only need to do this the first time. Once you have opened the Chart and formatted it, you can bookmark the URL to go directly there, next time.
Open your web browser (any one) and go to http://<yourMicrosIP>
e.g. http://10.1.1.100. Note:
the connection is http: not https:
pfodWeb
will request pfod's main menu. However the pi_picoCharting_Server.ino
sketch does not respond with a pfod main menu, it only send plot .csv
data.
So pfodWeb displays a Connection error msg.
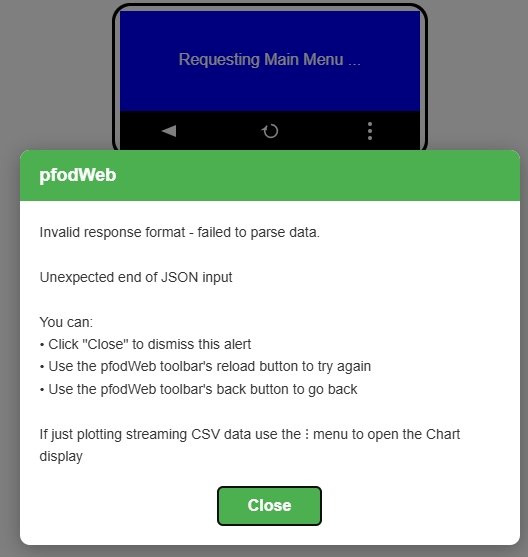
Close the error msg and click on the … menu and choose Chart
To display the default chart of the data being sent.
From here you can open the … Chart Configuration panel and
configure / load the chart settings you want.
This updates the
browser URL to
http://10.1.1.100/pfodWeb.html?targetIP=10.1.1.100&chart={=....
} which you can then bookmark. Opening the bookmark next time will
automatically open the Chart and apply the formats you set.
This page covered using pfodWeb to connect via Serial, BLE and HTTP to plot streaming CSV plot data. The Raspberry Pi Pico W / 2W was use as the example microprocessor, but any micro with a Serial connection can be used and Arduino micros with a Nordic 'UART' BLE Service or HTTP support can also chart data. Flexible formatting / zooming of the chart is supported and the format can be saved in a bookmarked URL for automatic re-application later. The data received can also be exported to a csv file for further analysis.
pfodWeb and pfodWebDesigner are free and open source. If you want
to support this work, purchase the Android pfodApp
which will work with the same code.
Also see the free pfodDesigner
Android app for creating menus and charts for pfodApp.
AndroidTM is a trademark of Google Inc. For use of the Arduino name see http://arduino.cc/en/Main/FAQ
The General Purpose Android/Arduino Control App.
pfodDevice™ and pfodApp™ are trade marks of Forward Computing and Control Pty. Ltd.

Contact Forward Computing and Control by
©Copyright 1996-2024 Forward Computing and Control Pty. Ltd.
ACN 003 669 994