pfodWeb — User Guide
pfodWeb is a browser-based interface for connecting to and interacting with pfod-compatible devices. It supports pfod drawings, live charting of CSV data, and offline plotting of saved CSV files. Support for pfod menus will be added later.
pfodWebDebug is identical to pfodWeb but with extra browser console logging enabled. Use it when diagnosing connection or display problems. All features described in this guide apply equally to both versions.
1. Opening pfodWeb
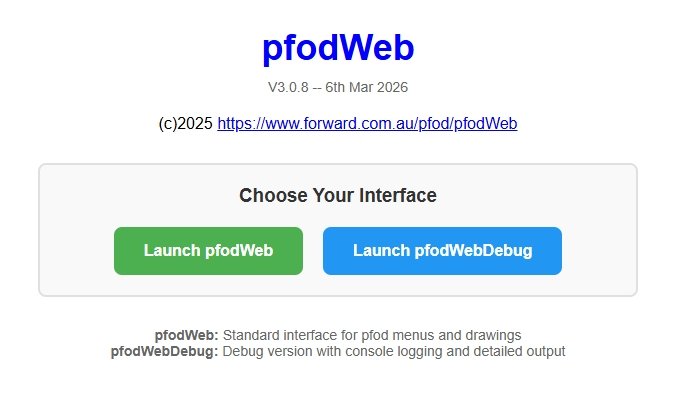
Open index.html in your browser. The launch page shows two buttons:
| Button | Description |
|---|
| Launch pfodWeb | Standard interface. Use this for normal operation. |
| Launch pfodWebDebug | Same as pfodWeb with additional console logging for debugging. |
Click either button to open the chosen interface. The version number is shown below the title.
2. Connection Setup
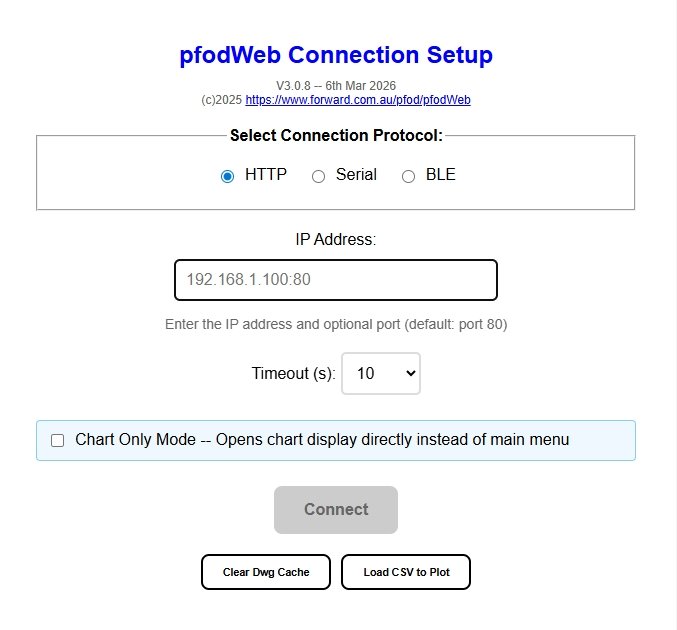
When pfodWeb first opens, it shows the Connection Setup screen. Configure your connection here before connecting to a device.
Protocol Selection
Choose how pfodWeb communicates with your device:
| Protocol | Description | Supported Browsers |
|---|
| HTTP |
Connects to a device over Wi-Fi using HTTP. Enter an IP address (e.g. 192.168.1.100) or a hostname — the browser will perform a DNS lookup. Default port is 80. |
Windows: Chrome, Edge, Firefox, Opera
Mac: Chrome, Edge, Firefox, Safari, Opera
|
| Serial |
Connects to a device via a USB serial port. Uses the Web Serial API. Select a baud rate from the dropdown, then click Connect to choose the serial port from a browser dialog. |
Windows: Chrome, Edge, Opera
Mac: Chrome, Edge, Opera
Not supported in Firefox or Safari.
|
| BLE |
Connects to a Bluetooth Low Energy device. Uses the Web Bluetooth API. Click Connect to scan for nearby BLE devices and select one. |
Windows: Chrome, Edge, Opera
Mac: Chrome, Edge, Opera
Not supported in Firefox or Safari.
|
Timeout
The Timeout dropdown sets how long pfodWeb waits for a response before treating the connection as failed. Default is 10 seconds for HTTP and 3 seconds for Serial/BLE. Increase the timeout if your device responds slowly.
Chart Only Mode
Tick Chart Only Mode to skip the pfod main menu and go straight to the chart display after connecting. Use this when your device only sends CSV chart data and you do not need to navigate pfod menus.
Bookmarking Your Connection Settings
After connecting, pfodWeb updates the page URL to include your current settings as query parameters (e.g. ?serial=115200 or ?ble or ?targetIP=192.168.1.100). If Chart Only mode was selected and a chart configuration has been applied, the URL also includes a &chart=… parameter.
You can bookmark this URL to reopen pfodWeb with the same settings pre-filled. Opening the bookmark shows the Connection Setup screen with your settings already filled in — click Connect to connect immediately. If the URL includes a chart= parameter, Chart Only mode is enabled automatically and the chart configuration is applied as soon as the connection is made.
Buttons
| Button | Description |
|---|
| Connect | Connects to the device using the selected protocol and settings. Opens the main pfodWeb display on success. |
| Clear Dwg Cache | Clears any cached pfod drawing definitions stored in the browser. Use this if drawings appear stale or incorrect after a device firmware update. |
| Load CSV to Plot | Opens a file picker to load a previously saved pfod CSV data file and display it as a chart — no device connection needed. See Section 6. |
3. Browser Settings for Each Protocol
HTTP
No special browser settings are required for HTTP.
However, the pfod device's web server must respond with CORS headers to allow the browser to accept its responses. When pfodWeb is loaded from a local file (file://), the browser treats the page as a null origin — which is different from the device's http://192.168.x.x origin — so CORS headers are required. The device must include at minimum:
Access-Control-Allow-Origin: *
CORS headers are not needed only if the pfod device itself serves pfodWeb.html, because in that case the page and the device API share the same origin.
Serial (Web Serial API)
Web Serial is supported in Chrome, Edge, and Opera without any flags on current versions.
| Platform | What may be needed |
|---|
| Windows |
Install the USB-to-serial driver for your adapter (e.g. CP2102, CH340, FTDI) if Windows does not recognise the device automatically. The driver adds a COM port that the browser can then list. |
| Mac |
Install any required USB-to-serial driver for your adapter.
Grant the browser access to the serial device: open System Settings → Privacy & Security and ensure the browser is allowed to access USB devices if prompted.
|
BLE (Web Bluetooth API)
Web Bluetooth is supported in Chrome, Edge, and Opera without any flags on current versions.
| Platform | What may be needed |
|---|
| Windows |
Windows 10 or later is required. The PC must have a Bluetooth 4.0 or later adapter. No additional browser flags are needed in current Chrome/Edge/Opera versions. |
| Mac |
Grant the browser Bluetooth permission: open System Settings → Privacy & Security → Bluetooth and make sure the browser (Chrome, Edge, or Opera) is listed and enabled. macOS will prompt for this on first use.
|
Note: If a BLE or Serial connection attempt produces no device list or an immediate error, check that the browser has the required OS-level permission (Bluetooth or USB) before looking for other causes.
4. Main Display Layout
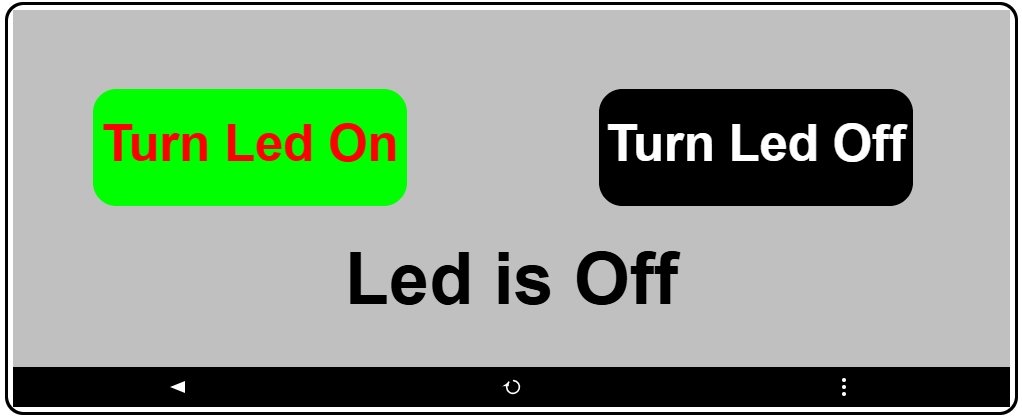
After connecting, pfodWeb shows the main canvas pane filling the full window. The main pane displays either a pfod drawing or a chart.
Side Panel (optional)
An optional side panel can be opened from the three-dot menu. When open, the display splits into two resizable panes separated by a draggable divider:
- Left pane — the main canvas area showing the pfod drawing or chart.
- Right pane (side panel) — shows the Raw Message viewer or Chart Configuration panel. Drag the divider left or right to resize.
Display Modes
The canvas pane operates in one of two modes:
| Mode | What is shown |
|---|
| Canvas mode | pfod drawings rendered on a canvas with a rounded mobile-phone style border. |
| Chart mode | Live or frozen chart(s) of CSV data received from the device. See Chart Mode Guide for full details. |
5. Toolbar
A black toolbar runs along the bottom of the canvas pane. The buttons shown depend on the current display mode.
Canvas (Drawing) Toolbar

Chart Toolbar

All Modes
| Button | Description |
|---|
| ◀ |
Go back — resends the previous pfod command to return to the previous menu or drawing. Disabled in Chart Only mode as there is no previous pfod command. |
| ⋮ |
Menu — Opens a context menu. Options depend on the current display mode:
Canvas mode: Open the Raw Message viewer side panel, or switch to chart display. The side panel also provides options to save data.
Chart mode: Open the Chart Configuration side panel. The side panel also provides options to save data.
|
Canvas Mode Only
| Button | Description |
|---|
| ↺ Reload |
Resends the last pfod command to refresh the current drawing or menu. |
Chart Mode Only
| Button | Description |
|---|
| ⏮ |
Step back — shifts the frozen display window back by 40% of the current Display Points. Only enabled when frozen. |
| Freeze / Freeze |
Toggles freeze on/off. When frozen the button turns red and the display window is locked. Live data continues to be collected. Click again to unfreeze and return to the live view. |
| ⏭ |
Step forward — shifts the frozen display window forward by 40% of the current Display Points. Only enabled when frozen. |
Tip: For full details on chart freeze, zoom, and configuration see the
Chart Mode Guide.
6. Load CSV to Plot
pfodWeb can plot data from a CSV file saved by a previous session (or any other CSV file) — no device connection is required.
- From the Connection Setup screen, click Load CSV to Plot.
- Choose a CSV file from your computer (files saved by pfod are named
pfod-csv-Nfields-<timestamp>.csv).
- pfodWeb opens directly in chart mode and plots the data. All chart features (freeze, zoom, Chart Configuration) are available.
Note: In CSV mode there is no server connection. All data comes from the loaded file.
7. Side Panel
The side panel on the right opens when you choose Raw Messages or Chart from the three-dot menu in Canvas (Drawing) mode. In Chart mode the choices are Raw Messages or Chart Configuration.
Drag the divider to give it more or less space.
Raw Message Viewer
Shows the raw pfod messages exchanged with the device, useful for diagnosing protocol issues. Messages are colour-coded by direction — green for sent, red for received.
Chart
Switches from Canvas (Drawing) display to Chart display.
Chart Configuration
When in Chart mode, lets you customise the chart — set the title, display points, X-axis format, and per-field settings (label, plot number, Y-axis limits, units). Changes take effect when you click Apply. See the Chart Mode Guide for full details.
8. Quick Reference
Connection Setup at a Glance
| Setting | Description |
|---|
| Protocol | HTTP, Serial, or BLE |
| IP Address | HTTP only — device IP address (e.g. 192.168.1.100) or hostname; browser performs DNS lookup. Default port 80. |
| Baud Rate | Serial only — select before clicking Connect |
| Timeout (s) | Response timeout in seconds (3, 5, 10, 20, or 30) |
| Chart Only Mode | Skip menus and go straight to chart display |
Toolbar Quick Reference
| Button | Mode | Action |
|---|
| ◀ | All (disabled in Chart Only mode) | Go back — resend previous pfod command |
| ↺ Reload | Canvas | Resend last command |
| ⏮ | Chart (frozen) | Step back 40% of Display Points |
| Freeze | Chart | Lock / unlock display window |
| ⏭ | Chart (frozen) | Step forward 40% of Display Points |
| ⋮ | Canvas | Open Raw Message viewer side panel, or switch to chart display |
| ⋮ | Chart | Opens Raw Message viewer or Chart Configuration side panel |