
|
Home
| pfodApps/pfodDevices
| WebStringTemplates
| Java/J2EE
| Unix
| Torches
| Superannuation
|
| About
Us
|

|
High Accuracy Remote Data Logging
|
by Matthew Ford 26th April 2017 (original
10th December 2016)
© Forward Computing and
Control Pty. Ltd. NSW Australia
All rights reserved.


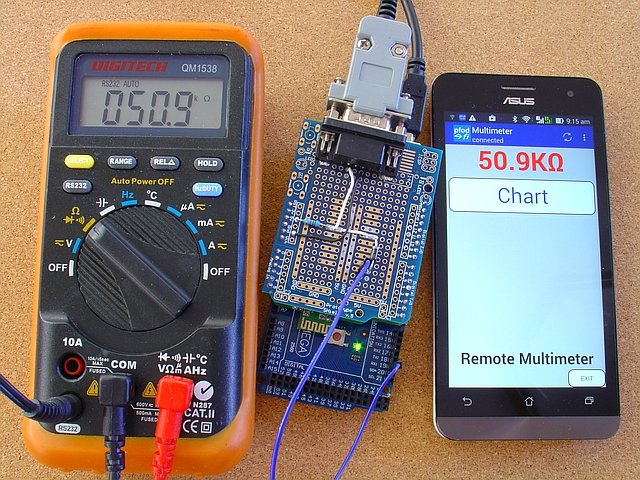
This tutorial shows you how access a wide range of high accuracy measurements from your Arduino and also send them remotely for logging and plotting. The AtoD converter built into the Arduino's has poor accuracy, typically +/-10% and very limited range, typically 0 to 5V DC volts only. Using a simple circuit and library, you can feed your Arduino with high accuracy auto-ranging measurements from a multimeter with an optically isolated RS232 connection. Having the measurements available to your sketch lets you control outputs based on the values. This tutorial also covers sending the measurement remotely, via WiFi, Bluetooth, Bluetooth Low Energy or SMS, to an Android mobile for display, logging and plotting using pfodApp.
This tutorial uses an Arduino Mega2560 5V board which you can pair with a wide variety of communication shields, Ethernet, WiFi, Bluetooth V2 (classic), Bluetooth LE or SMS. The interface hardware and library presented here can alos be used with 3.3V Arduino compatible boards. As well as the Mega2560 you can use a wide variety of other boards such as UNO with and Ehternet shield, an ESP8266 base board (stand alone), a board with integrated Bluetooth Low Energy, like Arduino 101, or boards that connect to the communication sub-system using SPI such as RedBear BLE shield and Adafrut's Bluefruit SPI boards. pfodDesignerV2 supports all of these board combinations and will generate the code for them. The limiting condition is that you need to have a free Hardware Serial to connect to the this Multimeter RS232 shield.
The circuit and code presented here works with a number of multi-meters. A readily available, inexpensive, one is a Tekpower TP4000ZC, also know as Digitek TD-4000ZC. Multi-meters that work with this circuit and library include Tekpower TP4000ZC, Digitek TD-4000ZC, Digitech QM1538, Digitech QM1537, Digitek DT-9062, Digitek INO2513, Digitech QM1462, PeakTech 3330, Tenma 72-7745, Uni-Trend UT30A, Uni-Trend UT30E, Uni-Trend UT60E, Voltcraft VC 820 and Voltcraft VC 840
This tutorial has two parts:
The first part covers the hardware interface to the multimeter and the code library using an Arduino Mega. If you only want to get the measurement into your Arduino this is all you need.
The second part covers sending the measurement to a remote Android mobile for display, logging and plotting. In this example we will use a Bluetooth shield and generate the basic sketch using pfodDesignerV2, but you can also generate code for WiFi, Ethernet, Bluetooth Low Energy and SMS connections using pfodDesignerV2. The multimeter library is then added to the basic sketch to complete the code. No Android coding is required to display, log and plot the reading. Everything is controlled from your Arduino code.
For a remote head-up display of the multimeter, see this instructable, Arduino Data Glasses For My Multimeter by Alain.
The multimeters used in this tutorial are the inexpensive (~US40) Tekpower TP4000ZC (also know as Digitek DT-4000ZC) and the older Digitech QM1538, which it is no longer sold. Both these meters are visually the same and use the same RS232 encoding of the measurement.
Here the specs for the Tekpower TP4000ZC:-
DC
Voltage: 400mV/4/40/400V ±0.5%+5, 600V ±0.8%
AC
Voltage: 4/40/400V ±0.8%+5, 400mV/600V ±1.2%+5
DC
Current: 400/4000μA ±2.0%+5, 40/400mA ±1.5%+5, 4/10A
±2%+5
AC Current: 400/4000μA ±2.5%+3, 40/400mA
±2%+5, 4/10A ±2.5%+5
Resistance: 400Ω/4/40/400kΩ/4MΩ
±1%+5, 40MΩ ±2%+5
Capacitance: 40nF ±3.5%+10,
400nF/4/40μF ±3%+5,100μF ±3.5%+5
Frequency:
10Hz-10MHz ±0.1%+5
Duty Cycle: 0.1%-99.9%
±2.5%+5
Temperature: 0oC - +40oC ±3oC, -50oC -
+200oC±0.75% ±3oC, +200oC - +750oC ±1.5% ±3oC,
Resolution 0.1oC via included thermocouple probe.
The multimeter's RS232 connection is only one way and you cannot change the multimeter's settings remotely, so you need to manually select the type of measurement. However the meter is auto-ranging and the Voltage and Current settings handle both AC and DC.
There are two interfaces. The newer Digitek DT-4000ZC and Tekpower TP40000ZC meters come with a USB cable. While the older Digitek QM1538 was provided a RS232 9pin D connector cable.
The following circuit (pdf
version) shows how to connect the multi-meter's opto coupler to
drive an Arduino RX serial pin.
Note:
This circuit has been updated to add another protection resistor, R2,
for the Digitek DT-4000ZC and Tekpower TP40000ZC meters. This
resistor was not included on the 9pin D connector board shown below.

For the Digitek DT-4000ZC and Tekpower TP40000ZC, you need a 3.5mm audio cable male to male, stereo or mono will do, and a 3.5mm socket.
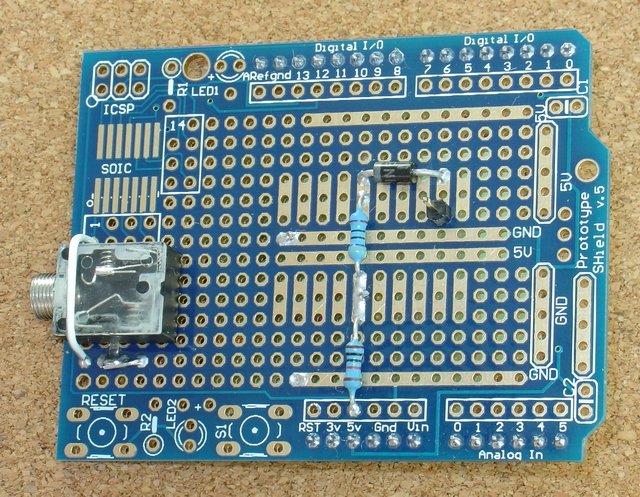

For the older Digitek QM1538, you
need a 9pin D socket.
The 9pin D connector has offset pins that
will not plug into the prototype shield. Just cut off the row of 4
pins so you can solder the connector to the board, as the circuit
only uses pins in second row of 5 pins. The mounting legs where bent
over to let the connector lie flat and the connector was secured to
the prototype shield using 2 part epoxy glue (“Araldite”)
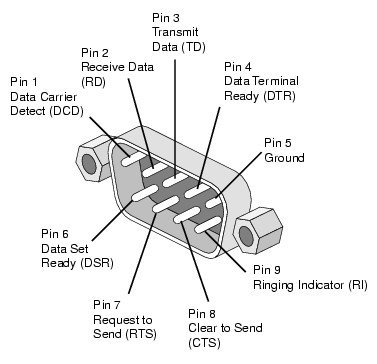
The connector
pin layout is shown above is from
this site. The 10K resistor that comes mounted inside the
connector of supplied RS232 cables (connected between pins 2 and 3)
is not required for this project.

This circuit will work for both 5V and 3.3V Arduino boards. Here we are using an Mega2560 (5V) Arduino and mounted the circuit on a prototype shield as shown above.
A flying lead is used to connect the TP1 on the shield to a Serial1 RX, pin D19, on the Mega2560.

Note about Software Serial: Initially this shield was paired with an UNO using Software Serial on pins 10,11. However when paired with the Bluetooth Shield on Serial at 9600baud, some receive bytes were lost. Moving the RS232 to a Hardware Serial connection solved this issue. So for reliable remote displaying and logging, if you are using a communication shield that connects via serial, you need either a board with two or more Hardware Serials such as the Mega2560. Other alternatives are an UNO with and Ehternet shield, an ESP8266 base board (stand alone), a board with integrated Bluetooth Low Energy like Anduino 101 or boards that connect to the communication sub-system using SPI such as RedBear BLE shield and Adafrut's Bluefruit SPI boards. pfodDesignerV2 supports all of these boards and will generate the code for them.
The Tekpower TP4000ZC and a number of other mulimeter do not send the measurement via RS232 as ASCII text, rather it sends 14 bytes with bits set depending on which segments of the LCD display that are illuminated. The encoding of the 14 bytes are explained in this pdf. The pfodVC820MeterParser.zip library decodes these bytes into text strings and floats. (The VC820 refers to one of the meters that uses this encoding.) Also see QtDMM for Windows, Mac and Linux computer software that handles a wide range of multimeters.
There is a minimal example, MeterParserExample.ino, of using the pfodVC820MeterParser library. Connect the meter to a 2400baud serial connection and then call haveReading() each loop to process the bytes. haveReading() will return true when there is a new complete reading parsed. Then you can call getAsFloat() to get the value (scaled) as a float or getAtStr() to get the reading with scaling for printing and logging. There are other methods available to access the type of measurement, getTypeAsStr() and getTypeAsUnicode(), as well as other utility methods.
#include "pfodVC820MeterParser.h"

pfodVC820MeterParser meter; //

void setup() {
  Serial.begin(74880);
  Serial1.begin(2400);
  meter.connect(&Serial1);
}

float reading;
void loop() {
  if (meter.haveReading()) {
    reading = meter.getAsFloat(); // use this for Arduino calculations

    Serial.print("Reading with units: ");
    Serial.print(meter.getDigits()); Serial.print(meter.getScalingAsStr()); Serial.print(meter.getTypeAsStr());
    Serial.print(F(" = as float printed (6 digits):")); Serial.println(reading,6);

    Serial.println("Time(sec) and Reading as string for logging");

    Serial.print(((float)millis())/1000.0); Serial.print(",sec,");
    Serial.print(meter.getAsStr()); Serial.print(','); Serial.println(meter.getTypeAsStr());
  }
}
With the meter set on Deg C and using the thermocouple probe, the
example sketch gives this output on the Arduino IDE serial
monitor
Reading with units: 25.7C = as float printed (6
digits):25.700000
Time(sec) and Reading as string for
logging
2.40,sec,25.7,C
This part of the tutorial covers how to remotely display, log and plot the meter reading on your Android mobile. pfodApp is used to handle the display, logging and plotting on your Android mobile. No Android programming is required. All the displays, logging and plotting are completely controlled by your Arduino sketch. The free pfodDesignerV2 app lets you design your Android menu and chart and then generates the an Arduino sketch for you.
pfodApp supports a number of connection types, Ethernet, WiFi, Bluetooth V2 (classic), Bluetooth LE or SMS. This tutorial uses Arduino 101 (Bluetooth Low Energy) for data logging and plotting. Other Bluetooth Low Energy boards are also supported. This tutorial uses SMS to connect to pfodApp. You can use pfodDesignerV2 to add data logging and charting to that SMS example. pfodDesignerV2 also has options to generate Arduino code to a Bluetooth V2 (classic) shield to connect to pfodApp.
For this example we will use an Iteadstudio Bluetooth Shield V2.2 that connects to the Arduino Mega2560 via a 9600baud serial connection. Using the free pfodDesignerV2 app we set up a simple menu that just has a label to show the meter reading and one button to open the chart. This page has a number of pfodDesignerV2 tutorials. Once we have a basic sketch, we will modify it to add the meter parser and to send the meter reading and data for logging and charting.
In this section we will design an Android/pfodApp menu that will display the meter reading and a button to open a chart of the readings. The readings are also saved to a file on the Android mobile.
Install the free pfodDesignerV2 and start a new menu.

The default Target is Serial at 9600baud which is what is need for the Iteadstudio Bluetooth Shield V2.2. If you are connecting using a Bluetooth Low Energy device or Wifi or SMS then click on Target to change the selection.
To add a label to display the meter reading, click on Add Menu Item and select scroll down to select Label.

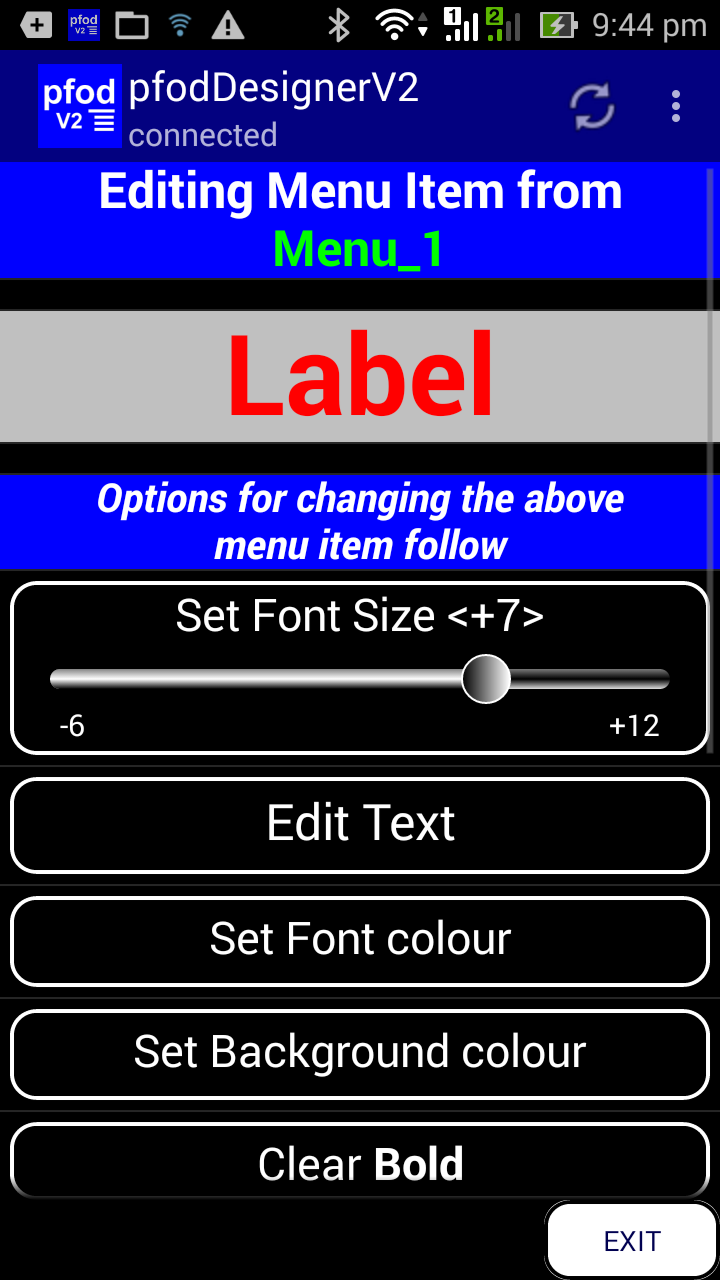
Choose a suitable font size and colours. Leave the Text as Label as we will modify the generated code to replace this with the meter measurement later. Here we have set font size to +7, font colour to Red and background to Silver.
Go back to the Editing Menu_1 screen and set a Refresh Interval 1 sec. The will make pfodApp re-request the menu about once a second to display the latest reading in the Label.
click on Add Menu Item again to add a Chart Button.
Edit the text of the Chart Button to something suitable, e.g. just “Chart” and choose a font size and colours.
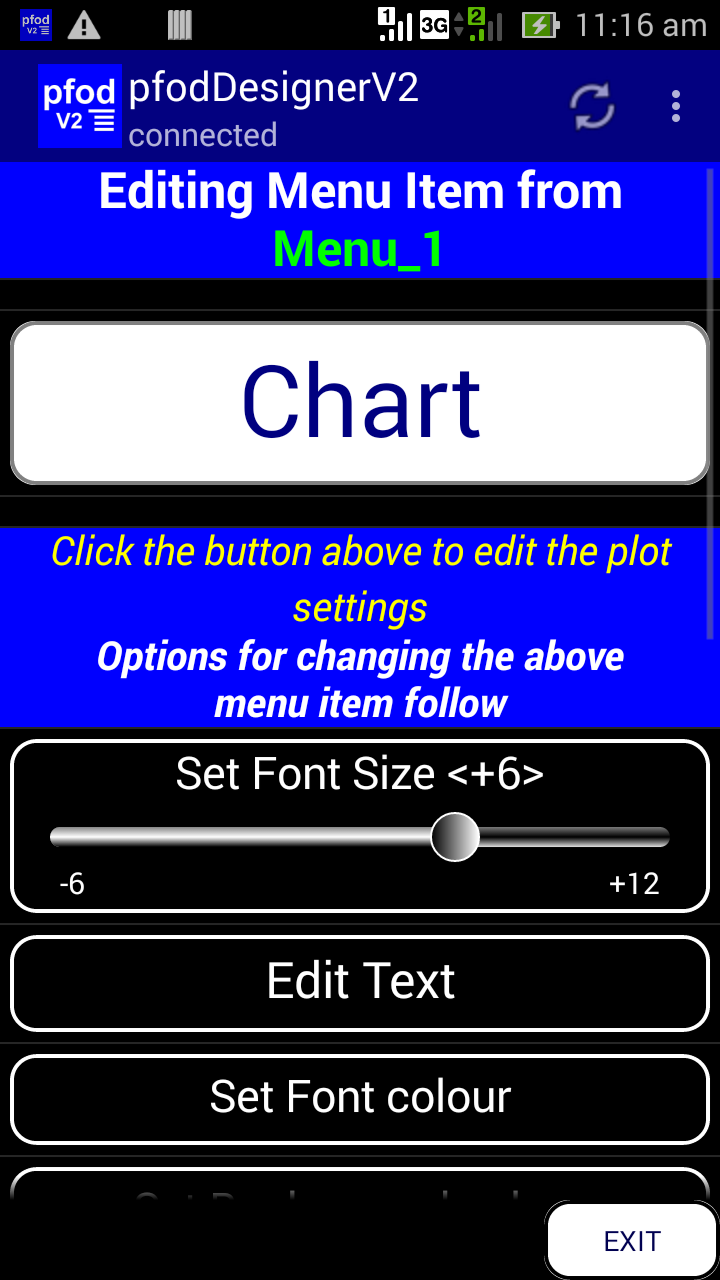
Then click on the “Chart” button to open
the plot editing screen. There will only be one plot so click in the
Edit Plot 2 and Edit Plot 3 buttons and scroll down and
click on Hide Plot for each of them.
Edit the chart label
to something suitable, e.g. “Multimeter”. No need to
change any of the other plot settings as we will be modifying the
sketch to send different y-axis label depending on the multimeter
setting.
Finally go back to the Editing Menu_1 and Edit Prompt, this sets the text at the bottom of the menu and overall menu background colour. Here we have set the prompt to “Remote Multimeter” with font size +3 and background colour Silver.

You can now go back to Editing Menu_1 and click Preview Menu to preview the menu design.
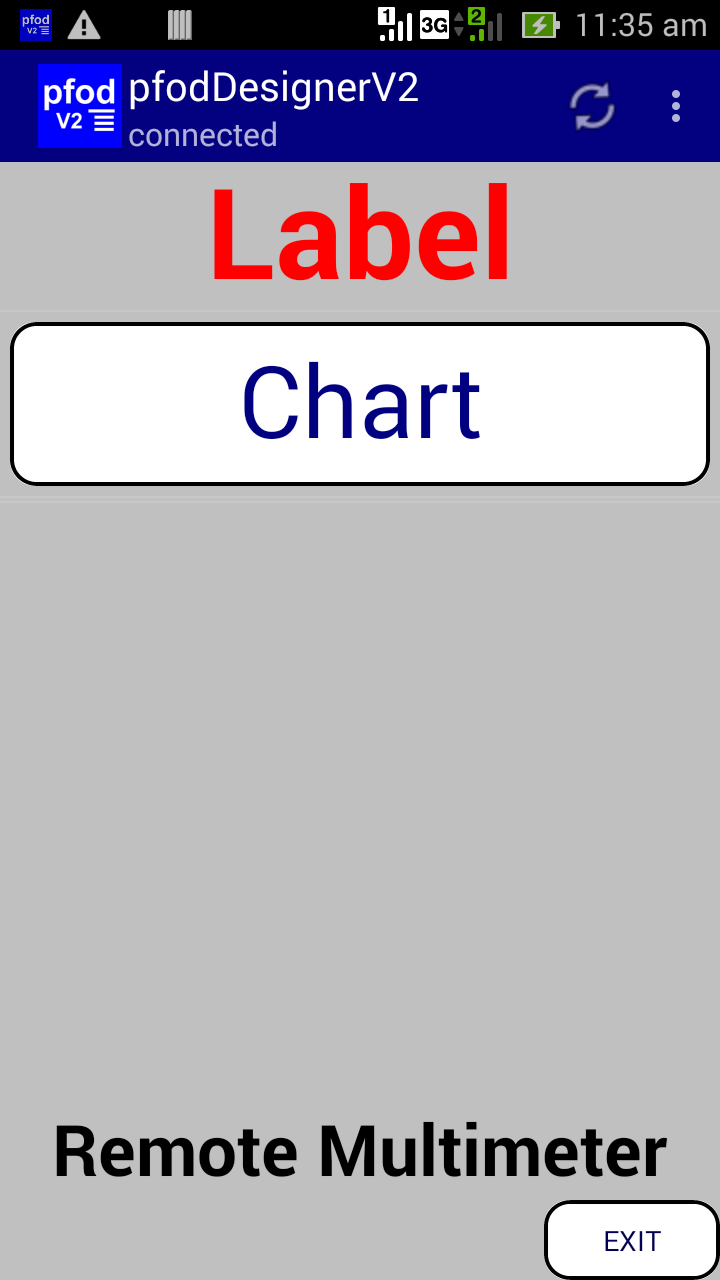
If you don't like the design you
can change it before you generate the code. If you want to space out
the Label from the button you can add some blank
labels as described here.
Adding
a Chart and Logging Data on How to Display/Plot Arduino Data on
Android is another tutorial on pfodDesignerV2/pfodApp datalogging
and charting.
To generate the Arduino code that will display this menu in pfodApp, go back to the Editing Menu_1 screen and scroll down and click the Generate Code button.

Click the “Write Code to file” button to output the Arduino sketch to the /pfodAppRawData/pfodDesignerV2.txt file on your mobile. Then exit the pfodDesignerV2. Transfer the pfodDesignerV2.txt file to your PC using either a USB connection or a file transfer app, like wifi file transfer pro. A copy of the generated sketch is here, pfodDesignerV2_meter.txt
Load the sketch into your Arduino IDE and program your Uno (or Mega) board. Then add the Iteadstudio Bluetooth Shield V2.2. The install pfodApp on your Android mobile and create a new Bluetooth connection named, for example, Multimeter. See pfodAppForAndroidGettingStarted.pdf for how to create new connections. Then when you use pfodApp to open the Multimeter connection you will see your designed menu.
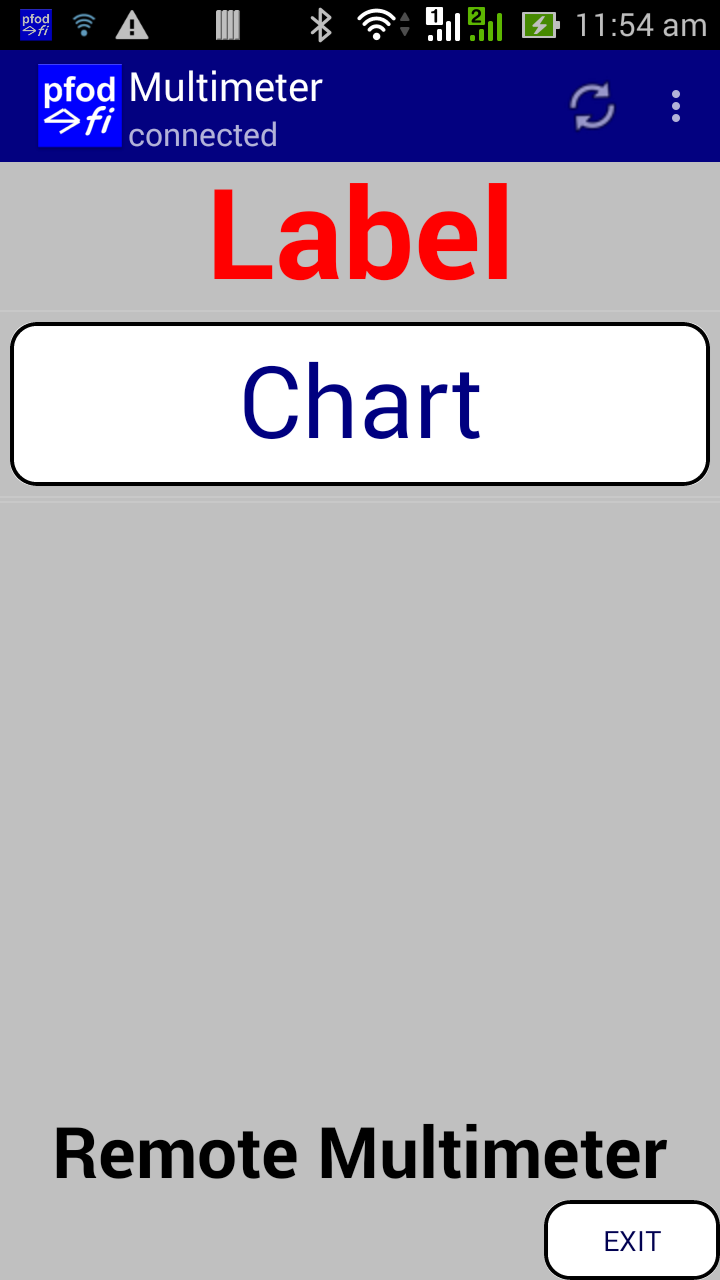
Opening the Chart does not display anything interesting because we have not added in the multimeter hardware/software.
We will modify the generated
sketch to add the multimeter parser and to send its data to your
Android mobile.
The complete modified sketch is here,
pfod_meter.ino
These modifications add the multimeter parser and a 5sec timer. If there is no new valid reading in that time then the sketch stops sending data and updates the Android/pfodApp display to “- - - “. As the meter's manual selection is changed the chart labels are updated, but you need to exit the chart and re-select it to see the new labels. On the other hand, the meter reading is automatically updated every second. Finally pfodApp handles Unicode by default so when displaying the meter reading the method getTypeAsUnicode() is used to return the Unicode for ohms, Ω, and degsC, ℃ for the meter display.
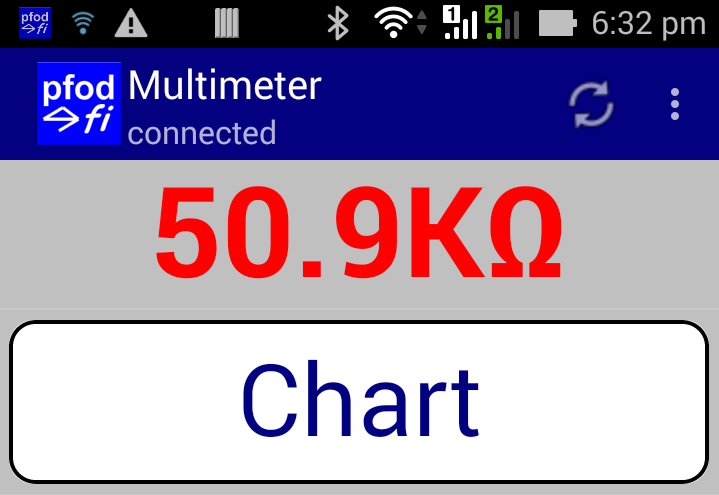

The chart button displays an updating chart of the readings :-

The chart data, in CSV format, is also saved to a file to your Android mobile under /pfodAppRawData/Mulitmeter.txt for later transfer to your computer and import to a spreadsheet for further calculations and charting.
The sketch modifications in detail are:-
Download the pfodVC820MeterParser.zip library and then open Arduino IDE and click in the Sketch → Include Library → Add .zip to add this library to your IDE.
Add the pfodVC820MeterParser library to the sketch. Click on Sketch → Include Library → pfodVC820MeterParser. This will add the include statements at the top of the sketch.
Edit pfodParser_codeGenerated
parser("V1"); to
pfodParser_codeGenerated
parser("");
This disables the menu caching in
pfodApp so your menu changes will be displayed. You can revert to
“V3” when you have finished all you changes to re-enable
menu caching.
Add these lines to create the objects for the
software serial and the multimeter.
pfodVC820MeterParser
meter;
At the end of setup()
add
Serial1.begin(2400);
meter.connect(&Serial1);
Above loop() add
unsigned long validReadingTimer = 0;
const unsigned long VALID_READINGS_TIMEOUT = 5000; // 5secs
bool haveValidReadings = true; // set to true when have valid readings
int measurementType = meter.NO_READING;
and
at the top of the loop() add
if (meter.haveReading()) {
    if (meter.isValid()) {
      validReadingTimer = millis();
      haveValidReadings = true;
    }
    int newType = meter.getType();
    if (measurementType != newType) {
    // output new datalogging titles
      parser.print(F("sec,")); parser.println(meter.getTypeAsStr());
    }
    measurementType = newType;
}
if ((millis() - validReadingTimer) > VALID_READINGS_TIMEOUT) {
   haveValidReadings = false; // no new valid reading in last 5 sec
}
Further
down in loop replace
parser.print(F("{=Multimeter|time
(secs)|Plot_1~~~||}"));
with
parser.print(F("{=Multimeter|time
(secs)|Meter Reading~~~")); parser.print(meter.getTypeAsStr());
parser.print(F("||}"));
At
the bottom of loop() replace
sendData();
with
if
(haveValidReadings) {
sendData();
}
In
sendData() replace
parser.print(',');
parser.print(((float)(plot_1_var-plot_1_varMin)) * plot_1_scaling +
plot_1_varDisplayMin);
with
parser.print(',');
parser.print(meter.getAsStr);
In
sendMainMenu()
replace
parser.print(F("~Label"));
with
parser.print('~');
if
(haveValidReadings) {
parser.print(meter.getDigits());
parser.print(meter.getScalingAsStr());
parser.print(meter.getTypeAsUnicode ());
} else
{
parser.print(F("- - -"));
}
In
sendMainMenuUpdate()
add
parser.print(F("|!A"));
parser.print('~');
if
(haveValidReadings) {
parser.print(meter.getDigits());
parser.print(meter.getScalingAsStr());
parser.print(meter.getTypeAsUnicode ());
} else
{
parser.print(F("- - -"));
}
To update the
reading when using menu caching.
This tutorial has shown how to connect an inexpensive multimeter to an Arduino Mega2560 via RS232. Many other boards are also supported. The pfodVC820MeterParser library parses the multimeter data into floats for Arduino calculations and strings for display and logging. pfodDesignerV2 was used to generate a basic sketch to display the multimeter reading and show a plot of the values in an Android mobile using pfodApp. No Android programming is required. To this basic sketch the multimeter handling was added and final sketch displays the current multimeter reading on your Android mobile as well as plotting the readings and logging them to a file on your mobile for later use.
AndroidTM is a trademark of Google Inc. For use of the Arduino name see http://arduino.cc/en/Main/FAQ
The General Purpose Android/Arduino Control App.
pfodDevice™ and pfodApp™ are trade marks of Forward Computing and Control Pty. Ltd.
Contact Forward Computing and Control by
©Copyright 1996-2020 Forward Computing and Control Pty. Ltd.
ACN 003 669 994