
|
Home
| pfodApps/pfodDevices
| WebStringTemplates
| Java/J2EE
| Unix
| Torches
| Superannuation
| CRPS Treatment
|
| About
Us
|
|
|
BLE Low Power Indoor/Outdoor Weather Station
|
by Matthew Ford 10th July 2026 (originally posted 20th
May 2022)
© Forward Computing and Control Pty. Ltd. NSW
Australia
All rights reserved.

Update 10th
July 2026 – replaced battery in WL-1 after
4years 1months
Update 13th Apr 2024 – added code for
VLEM7700 version of sensor
Update 23rd Sept 2023 – added
note about cutting I2C pullups pad on VLEM7700
Update 16th
Jan 2023 – added high/low temperature
comments
Update 14th
Jan 2023 – installing ESP32 V2.0.6 board
support seems to fix the previous problems with Adafruit
QT Py ESP32-C3)
Update 5th
November 2022 – Rev 2a added connection
timeout
Update 6th
August 2022 – Rev 2 added hPa plot and
charts and time/date
Update 1st
July 2022 – “Due
to reports of Andy OS including an undisclosed cryptocurrency mining
software we (CNET)
have opted to remove the download link.” Try
Bluestack instead.
This indoor/outdoor Weather Station is the third in a series of Very Low Power BLE - 2022 projects. The very low power BLE temperature, relative humidity and barometric pressure sensor is an extension of the Very Simple, Very Low Power BLE Temperature Sensor The BLE sensors operate between -40degC and 85degC, are simple to make and run for ~4 ½ years on a coin cell.
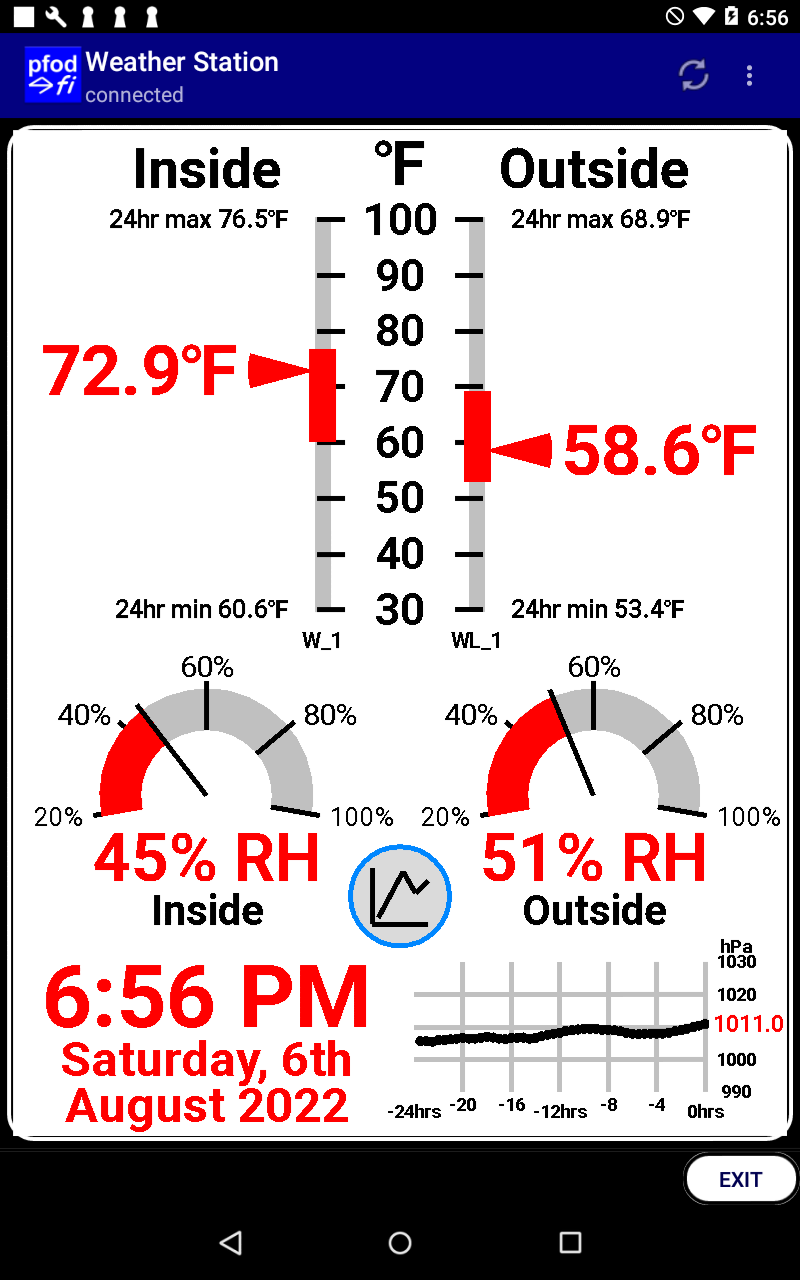
All the display code is in your Arduino sketch, so you can customize the display as you wish, such as changing temperature range to suit your locality (see the Sketch Configurations section below) and changing the colours to suit your taste. pfodApp has been under continual development for over 10 years and the current version runs on Android mobiles 8 years old, so you can use one of your discarded mobiles for this weather station display or you can buy an inexpensive second hand out of date tablet.
This revision 2 simplifies the BLE to WiFi bridge to just one less expensive board (ESP32-C3), no wiring needed. Revision 1 of the project is here. It also adds a hPa plot, time and date and a chart button to display the last 36 hrs of temperature, RH and hPa. (Code is also included to update the previous BLE-WiFi hardware) This project uses pfodApp to display the weather station on an Android mobile.
The
project consists if 3 parts:-
1) the Weather
Station display.
2) the BLE to WiFi bridge
(ESP32-C3)
3) the Very Low Power BLE
sensors
The
Weather Station Display and BLE to WiFi Bridge
The
Display Gauges
The Very Low Power BLE
Sensors
Component
Selection and Construction
Construction
There are a number of options for the Weather Station Display :-
You can use the ESP32-C3 to serve a simple web page with the current values. See the Web Page Temperature Display section of a Simple BLE Temp Sensor for Beginners for an example of a very simple web page.
You can use the ESP32-C3 to post the readings to the cloud and then process and plot them from there (this use of the C3 running with BLE has not been tested).
You can use pfodApp on an Android mobile/table to display the Weather Station gauges as shown above. Since pfodApp works on Android devices from 8 years ago, you can resurrect one of you old devices to use as the display. Even a new inexpensive Android tablet is price competitive with a similar size LCD/TFT display. You can also use BlueStack on a PC/Mac to display the Weather Station.
In this project, pfodApp will be used to display the Weather Station. pfodApp keeps all the display code in your Arduino sketch. No Android coding is required. Once you design the graphical gauges (see Custom Arduino Controls for Android), you can easily position and scale them on the screen. Since all the code is in your Arduino sketch you can modify the Weather Station display as you require. pfodApp also simplifies plotting. Revision 2 adds a chart button to open a chart page with the last 36hrs of measurements. You can zoom the plots using two finger pinch/spread.
You will know when you have the display/gauges setup correctly when other household members complain when the Weather Station is not running.
To connect the BLE sensors to the Weather Station a BLE to WiFi bridge is used. Revision 1 use the simple hardware from Simple WiFi to Bluetooth Low Energy (BLE) Bridge and programs it to work as a BLE to WiFi bridge instead. This Revision 2 uses the cheaper ESP32-C3 single board to handle both the BLE and WiFi connections
There are a number of options for the BLE sensors. This project covers a simple temperature sensor, a temperature + relative humidity + barometric pressure sensor and a a temperature + relative humidity + barometric pressure + light level sensor. Each of these sensors are simple to construct and will run for four (4) years on a CR2032 coin cell. You can read multiple sensors with the one BLE to WiFi bridge and you can read the same sensor with multiple BLE to WiFi bridges.
At temperatures below -5degC a user has reported run times of less
than 2hrs for the temperature sensor running on a CR2032 coin cell.
His solutions was to use 2xAA alkaline batteries instead.
At
temperatures above 30degC with direct summer sun on the plastic box
housing the ES32-C3 (BLE to WiFi bridge), the ESP32-C3 would reboot.
The solution was to a) reposition the box out of the sun and b) add
vent holes at each end of the box to allow circulation of air over
the ESP32-C3 module.
This project used the following parts :-
The
Display
An old Nexus 7 tablet (2015)
API V5.1.1 and USB supply and cable
pfodApp
~US$8.50
BLE to WiFi Bridge
ESP32-C3 Mini Development Board – ~US$9
https://www.sparkfun.com/products/18036
(Update 14th Jan
2023 – installing ESP32 V2.0.6 board support seems to fix the
previous problems with Adafruit
QT Py ESP32-C3)
USB
power supply (500mA or more) – ~US$6
https://www.sparkfun.com/products/12890
OR
~US$7
https://www.adafruit.com/product/1994
OR similar
USB
A to Micro B cable – ~US$2
https://www.sparkfun.com/products/13244
(6 inches long) OR
similar
The
Very Low Power BLE Sensors
2
x GT832E_01 ~US$15.90 each, mounted on vero board
2 x Sparkfun
BME280 board ~US$21.50 each
2 x Sparkfun
coin cell holder PRT-00783 US$1.60 each and
2 x CR2032
coin cell PRT-00338 ~US$2.10 each
1 x programmer MuseLab,
CMSIS-DAP
(~US$9)
Optional -- 1 x Sparkfun
VELM7700 (~US$6 and 10 x 22uF capacitors 445-173294-1-ND
~US$10 for 10 off
Arduino
Libraries – install the latest
versions
ESPAutoWiFiConfig
(prompts to install SafeString
as well) – available from the Arduino Library manager or as zip
files
pfodParser
– available from the Arduino Library manager or as zip
files
SparkFun_BME280_Arduino_Library-master.zip
(local
copy here) – install using Arduino Menu Sketch →
Include Library → Add Zip file..
Very
Low Power BLE board support as documented here.
Arduino Weather Station Sketch Rev 2
for
ESP32-C3 ESP32C3_WeatherStation_Rev2a.zip
for
ESP8266 (Rev 1 hardware) ESP8266_WeatherStation_Rev2a.zip
Hook up wire and vero board and plastic sheet/cases
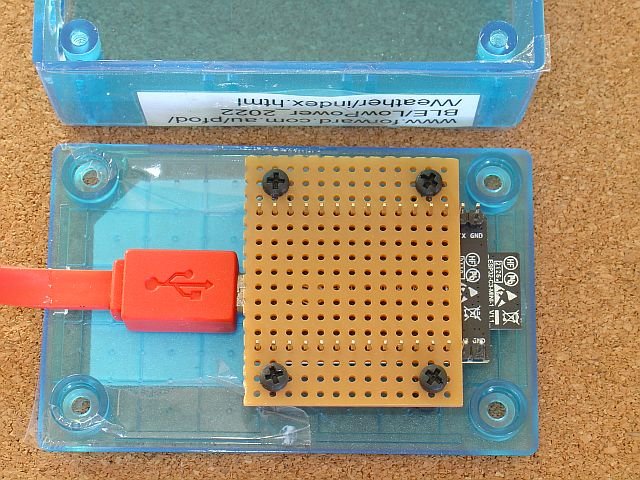
To set up to program the ESP32-C3 see the instructions on Single Board BLE to WiFi Bridge ESP32 C3
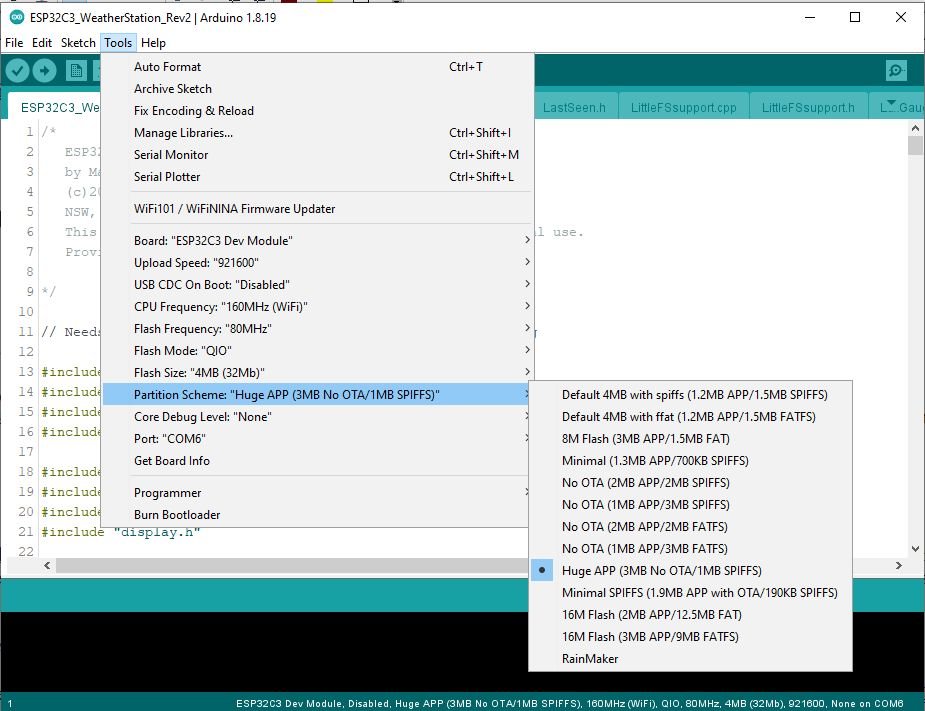
The ESP32-C3 handles both the BLE scanning for the sensor broadcasts/advertising AND sets up a WiFi server to serve the Weather Station display and plot data. Unzip ESP32C3_WeatherStation_Rev2a.zip to your Arduino sketch directory (If you are updating Rev 1 ESP8266 hardware use ESP8266_WeatherStation_Rev2a.zip) and program the ESP32-C3.
Note: The program is large and you need to select the Partition Scheme for Huge APP (similarly for the ESP8266 if you are updated Rev 1 hardware)
There are a number of setting to configure in the sketch. The WiFi connection is handled by the ESPAutoWiFiConfig library, so you don't need to specify your WiFi settings see ESP32 / ESP8266 Auto WiFi Config for the details.
The other configurations are:- BLE sensor names to scan for, Degrees C or Degrees F to display, Temperature Range to display, hPa correction to Mean Sea Level (MSL) and the Time Zone.
The BLE sensor names are set at the top of the display.cpp file. Here the outside sensor has a Lux sensor as well. For just Temp and RH and hPa, W_1, and W_2, would be appropriate.
// These are the names of the BLE devices to listen to
static const char OUTSIDE_DEVICE[] = "WL_1,"; // note the trailing , so T_1, does not match T_11,
static const char INSIDE_DEVICE[] = "W_1,";
These names must match the ones you coded into your BLE sensors. See the Very Low Power Sensors section below.
The ESP32-C3 sketch scans for all BLE devices nearby but filters for the advertised name of the devices it is interested in. The following code, in setup(), specifies which devices are of interest, using the names defined in display.cpp, accessed by the methods getOutsideDevice() and getInsideDevice()
  // add the names we are interested in NOTE the trailing , so that T_1, does not match T_11,
  LastSeen *devicePtr = new LastSeen(getOutsideDevice()); // note MUST use new since pfodLinkedPointerList uses delete when remove() called
  listOf_BLE_LastSeen.add(devicePtr);
  // add other devices here that you want to scan for
  devicePtr = new LastSeen(getInsideDevice());
  listOf_BLE_LastSeen.add(devicePtr);
A Weather sensor (W_1, ) Temperature + RH + hPa, and a Weather + Lux sensor (WL_1, ) are picked up. See Naming Sensors, below, for how the devices are named depending on their capabilities. If you use different sensors with other names you should change the OUTSIDE_DEVICE, INSIDE_DEVICE accordingly. The sketch simply continually scans for BLE devices and checks if their advertised name starts with one of those we are interested in. A linked list is used to hold the names we are interested in as well as when they were last scanned. Once a device of interest has been found further scans of it are ignored for the next 11secs since the sensors only advertise for 10secs every 100secs
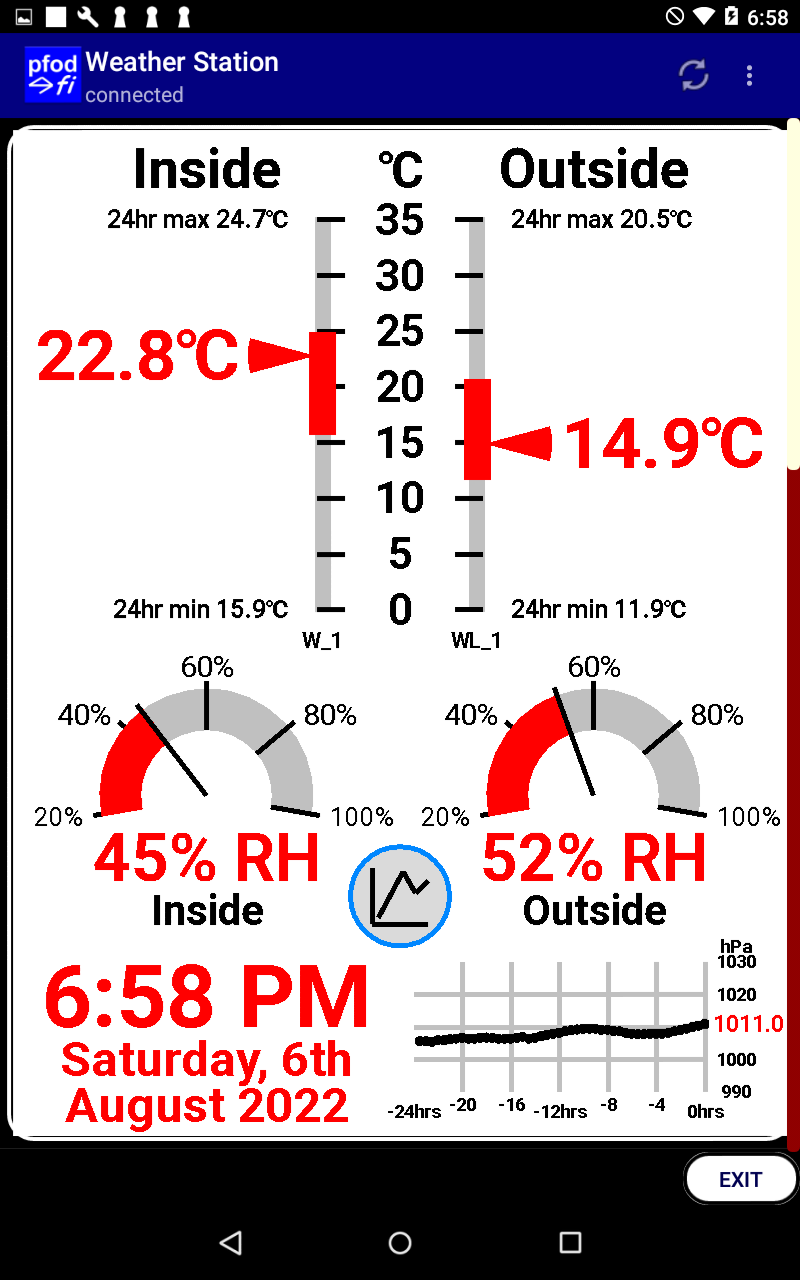
Setting Degrees C or Degrees F is done via #define at the top of the display.cpp file. The default is degrees C, un-comment
#define DEGS_F
to get a degrees F display. The sensor measurements are always in degsC and stored in degsC and converted for degs F displays and charts
The range of temperatures on the scales are set by the inside_temp, outside_temp constructors at the top of the display.cpp file. e.g
TempGauge_C inside_temp(&dwgs, false, 0, 35, false); // scale points on right, current temp on left 0 to 35degC range, no labels
TempGauge_C outside_temp(&dwgs, true, 0, 35, false); // scale points on left, current temp on right 0 to 35degC range, no labels
The inside and outside ranges must be set the same as only one scale is drawn for both.
If the temperature exceeds the scale range the correct reading
will be displayed at the top or bottom of the scale.
The chart of
the previous 36 hrs readings will automagically expand to accommodate
higher or lower readings.
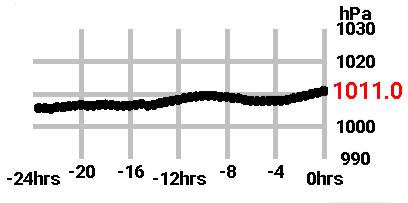
There is no configuration for the hPa plot on the main page. The correct current reading is always in red on the right but if the reading exceeds the scale those points are not plotted. Open the last 36hrs chart for all the entire plot.
The barometric pressure falls with rising elevation so it is common to apply a correction for the sensor's elevation to reduce the reading to the Mean Sea Level reading. This correction is at the top of the display.cpp file.
float hPaOffset = +7.3; //hPa adjustment for altitude difference
It can be calculated by comparing your reading to that of a nearby meteorological station.
The time zone needs to be set to display the correct time and date taking into account the local timezone and daylight savings (if any). The timezone is set at the top of the ntpSupport.cpp file.
const char* get_ntpSupport_DefaultTZ() {
  return "AEST-10AEDT,M10.1.0,M4.1.0/3";
}
See see https://github.com/nayarsystems/posix_tz_db/blob/master/zones.csv for a list of time zones and their posix_tz strings and see Explanation of TZ strings (local copy here) for how this string is constructed.
The code uses English language labels for the screen display, but you can edit the code to replace them with your own native language text. pfodApp accepts UTF-8 text. You may be able to just type your native text directly into the Arduino IDE. If not then you can use the UTF8converter1_0_1.jar program from Using Non-ASCII chars in Arduino to convert your text to Octal and then paste that into Arduino
The ESP32-C3 is programmed as a pfodDevice to serve up the Weather Station's graphical display to pfodApp on an Android mobile/tablet or PC or Mac running BlueStack. The Weather Station Display in this project is an old Android tablet. pfodApp will run on Android versions back to Lollipop (API 5), Nov 2014, so you probably have an old Android mobile lying around that you can use for the display.
There are lots of options for the layout and gauges used for the Weather Station. See Custom Arduino Controls for Android for a tutorial on creating pfodApp controls in your Arduino sketch. The display.cpp together with the various components in ESP32C3_WeatherStation_Rev2.zip creates the display above. The display refreshes every 20 seconds.
The sensors advertise the readings for 10sec every 100sec. If the ESP32-C3 BLE scanner misses a reading due to interference, out-of-range, low battery, etc then the display will update with the time since the last reading was received e.g. outside WL_1 will update to WL_1 4 mins ago.
The main screen display is a drawing menu item (A) that loads the dwg 'z' (see display.cpp) The dwg loaded consists of a number of sub-elements and an inserted dwg. The entire display is completely controlled by the Arduino's sketch code so you can change it as you wish to your own colours or language.
The hPa plot on the main screen is coded in hPa_BarGraph.cpp. It differs from the other elements in that it is a separate dwg that is loaded separately from the main screen dwg and then scaled and inserted at the appropriate offset in the main screen dwg.
The sendMainMenu() code creates a dwg menu item (see the free pfodDesigner app for designing menu items) that fills the menu item with dwg 'z'
parser.print(F("|+A~z"));
When pfodApp displays this menu item it automatically sends
commands to load the dwg 'z'. Since messages sent to pfodApp are
limited to 1024 bytes, the dwg is loaded in several parts. Once
loaded the dwg is cached by pfodApp under the parser version number
pfodParser parser("V1");so that subsequently only the changes need to be sent to update the existing dwg with the latest changes. These updates must be completely contained within a single 1024 byte message. 1024 bytes is not enough to send the various gauge updates AND the updates for the hPa plot. Making the hPa plot a separate dwg 'x' inserted in the main dwgs ('z') avoids this limitation.
In sendDrawing_z4(), the 5th part of dwg 'z', these statements insert the entire 'x' dwg at offset 59,127 with a scaling of times 0.07
  dwgs.pushZero(59, 127, 0.07);
  dwgs.insertDwg().loadCmd('x').offset(0, 0).send();
  dwgs.popZero(); // undo the previous pushZero
When pfodApp processes this part of the dwg message it queues commands to load the 'x' dwg and insert it. Again the initial load of 'x' is cached and subsequently only the updates are loaded to update dwg 'x' before inserting it.
Inserting dwgs can also be used to pan and zoom in on just part of a dwg. See Arduino UNO/Mega Starter for an example of zooming.

The chart button is coded in ChartButton.cpp. The CharButton::draw() method draws the button background and adds a touchZone and a touchAction.
  dwgsPtr->circle().idx(charCircle_idx).color(33).radius(8).send();
  dwgsPtr->touchZone().cmd(cmd).centered().size(8, 8).send();
  dwgsPtr->touchAction().cmd(cmd).action(
    dwgsPtr->circle().idx(charCircle_idx).filled().color(dwgsPtr->BLUE).radius(11) // change colour and make larger
  ).send();
When pfodApp process a touchZone, it starts listening for user touches in that area. (The area is automatically enlarged to finger size if too small.) There are various types of touches the pfodApp touchZone can filter for:- TOUCH, finger DOWN, finger DRAG, finger UP, CLICK, PRESS, finger Enters zone, finger Exits zone, finger DOWN then UP and DISABLE. The default is just TOUCH.
See Custom Arduino Controls for Android for a tutorial on TouchZones.
When pfodApp detect the user's touch, it immediately updates the dwg with the update specified in the touchAction. In this case it makes the blue circle into a larger filled circle. At the same time, pfodApp sends the associated menuItem cmd and this touchZone cmd together with the touch co-ordinates and type of touch to the pfodDevice (the ESP32-C3). In the display.cpp, the code in the Arduino sketch, in handle_pfodParser(), processes this press and sends back a message to open the chart screen and start loading the last 36hrs of data.
    } else if ('A' == cmd) { // user pressed menu item that loaded drawing with load cmd 'z'
      byte dwgCmd = parser.parseDwgCmd();  // parse rest of dwgCmd, return first char of active cmd
      if ((dwgCmd == chart_cmd)) { // the click / touch filtering happens in the pfodApp to filter when to send these cmds
        // open plot window and send latest data
        parser.print(F("{=In/Out Temp/RH and Barometric Pressure`"));
        parser.print(ARRAY_SIZE); // plot all the data, default is to only plot last 500
        parser.print(F("~E HH:mm"));
        if (!sending_plotData) {
          parser.print(F("~C")); // clear last plot data
        }
        parser.print(F("|date`0|hPa~1030~950~hPa`3|Temp In~100~30~\342\204\211`1|Temp Out~100~30~\342\204\211`1|RH In~100~0~RH%`2|RH Out~100~0~RH%`2}"));
        start_DataSend();
The data is sent as simple csv (comma separated values) and can be logged to a file by pfodApp for later export and further processing.
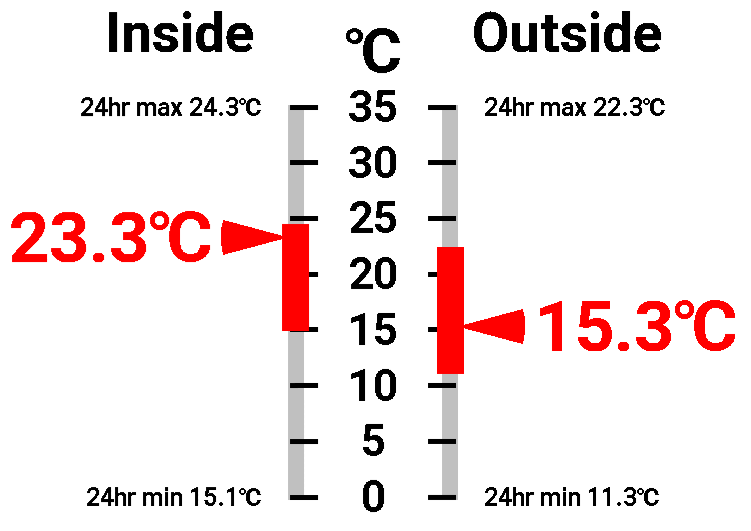
This display is a combination of two deg C gauges with labels suppressed on each gauge and the labels written separately in the middle.
TempGauge_C inside_temp(&dwgs, false, 0, 35, false); // scale points on right, current temp on left  0 to 35degC range, no labels
TempGauge_C outside_temp(&dwgs, true, 0, 35, false); // scale points on left, current temp on right  0 to 35degC range, no labels
The Inside / Outside labels are added separately (see the code in sendDrawing_z2() and sendDrawing_z3() in display.cpp). The temperature gauges include an indicator for the range of temperatures over the last 24hrs. Temp24hrMaxMin.cpp keeps track of the max/min over the last 24hrs.

The Relative Humidity Gauge code is in rh_Gauge.cpp
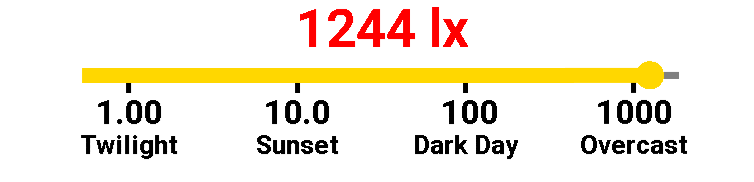
There is also a lux gauge, Lux_Gauge.cpp
The outside sensor includes a light sensor. This returns a lux reading. However the outside sensor is placed in the shade to prevent direct sun from effecting the temperature reading. This reduces the lux reading. To compensate for this the code in the display.cpp scales the reading by x 2 before storing it for display. This factor was estimated from another VEML7700 sensor in full sun. For the next project ,which intends to use the lux reading to turn the hall night lights on and off, the actual true lx value is not important as the switching set point can be set as necessary, however the x 2 factor gives a “Sunset” reading at sunset.
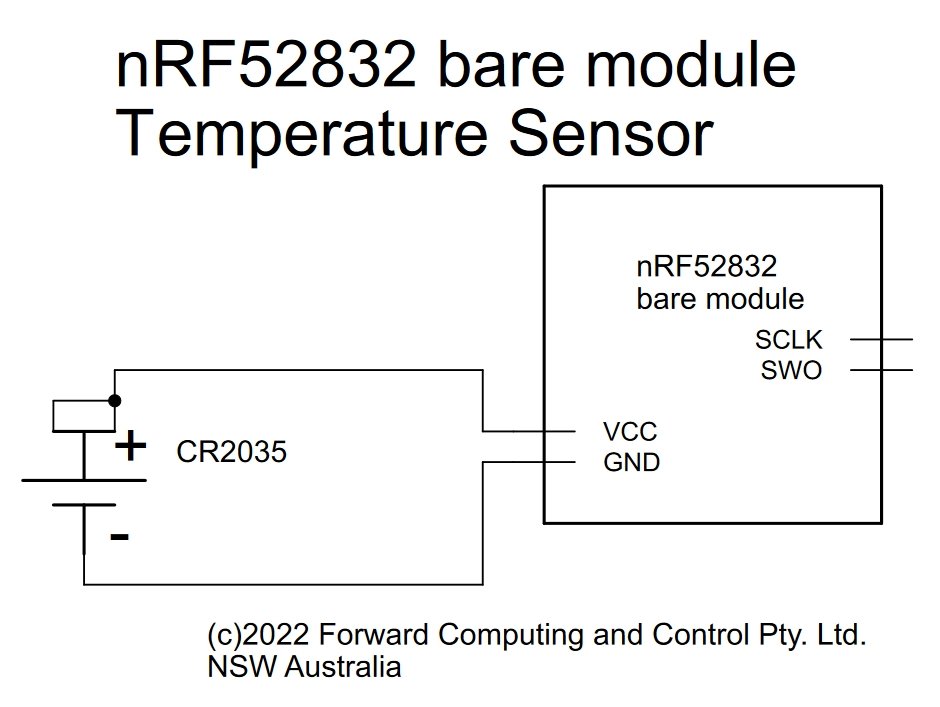
The two basic components are a nRF52832 'bare' module and a coin cell (in a holder).
The following nRF52832 'bare' modules available from Aliexpress
can be used. They include:-
GT832E_01 ~US$15.90 mounts on vero
board
Jessinie XL52832-D01 nRF52832 module ~US4.90 and Jessinie
Test Board Adapter Plate for NRF52832 ~US$1.70 – Total
~US$5.60
BLM-KTB522 ~US$6.30 (no crystal) pin for pin replacement
for Skylab SKB369, needs to be mounted on a PCB
Those 'bare' nRF52832 do not have any extra components or power regulators that will used extra current.
Add to this a CR2032 coin cell and holder,
e.g.
Sparkfun
coin cell holder PRT-00783 US$1.60 and CR2032
coin cell PRT-00338 ~US$2.10 – Total US$3.70
So using the Jessinie module and adapter and a coin cell and holder the total cost (excluding shipping) is < US$10
A
Simple BLE Temp Sensor for Beginners shows you how to use just
these two components to get a usable BLE temperature sensor.
For
the relative humidity and barometric pressure, you need to add a
Sparkfun
BME280 board (~US$21.50) Adding this very low power board gives
about 4 and a half years of run time on a CR2032 coin cell. It also
avoids the time consuming temperature calibration so you may choose
to used it just for the temperature sensor also.
This project also
includes a light sensor, Sparkfun
VELM7700 (~US$6) . Sparkfun
VELM6030 (~US$6) also looks suitable, but was not tested. Because
the light sensor only works down to 2.5V, you do cannot access the
full capacity of the coin cell (down to 2V). This reduces the run
time to about 3 and a quarter years.
Note: the Adafruit versions of these boards Adafruit BME280 and Adafruit VEML7700 Lux Sensor are NOT suitable, because they include additional components that increase the supply current.
The WL_1 sensor, which includes a temperature, relative humidity, barometric pressure and light sensor, is placed outside and the W_1 sensor, without the light sensor, is used inside. If you don't want the light sensor, use the simpler W_.. sensor (see below) and modify the Weather Station Bridge code (below) to filter for W_.., instead of WL_1, e.g filter for W_2, for example if the sensor's name is W_2,
Since these sensors are so simple and inexpensive to make, you may well end up with a number of them advertising the temperature and/or other measurements, from various locations. To distinguish between them, the lp_BLE_Temp_uC.ino sketch uses the following convention. The temperature sensors advertised name starts with T_ followed by a number, e.g T_1, followed by a comma and the temperature value. This design will also be the basis for other sensors which add a very low power, temperature/humidity sensor or a temperature/humidity/barometric pressure sensor and/or a lux sensor.
This project used the following name format
Format of advertised name, e.g. T_5,25.5
LOCAL_NAME prefix T_..
devices LOCAL_NAME,degC
LOCAL_NAME prefix H_.. devices
LOCAL_NAME,degC,%RH
LOCAL_NAME prefix W_.. devices
LOCAL_NAME,degC,%RH,hPa
LOCAL_NAME prefix WL_.. devices
LOCAL_NAME,degC,%RH,hPa,Lux
Set LOCAL_NAME, at the top of the sensor sketches and then use the prefix to parse the advertised data.
Follow the instructions in Easy Very Low Power BLE in Arduino -- Part 1 2022 to setup the Very Low Power BLE support for nRF52832 boards and programmers.
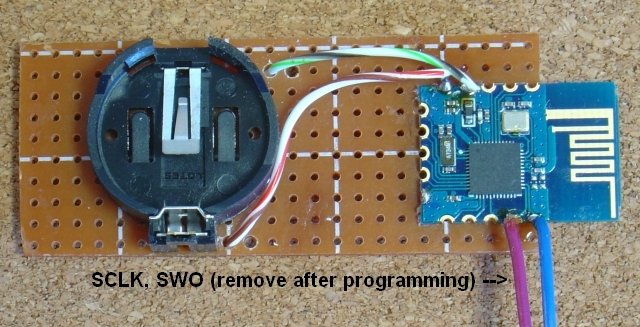

The construction and calibration of the T_1
sensor is described in Simple
BLE Temp Sensor for Beginners. Because the nRF52832 on-board
temperature measurement is not very accurate, the T_1 sensor requires
calibration before use.
After determining the calibration
correction the nRF52832 is programmed with the lp_BLE_Temp_uC.ino
sketch. This sketch only has constant correction. You may need a
formula as described Multi-point
Calibration . The sketch is set to advertise for 10 secs every
100sec and T_1 should run for about 5 years on a CR2032 cell.
To avoid doing a multi-point calibration, you
can instead fit a Sparkfun BME280 temperature, humidity and
barometric pressure sensor. Again the circuit is trivial (pdf
version)
If you don't need the sensor including the light
sensor, WL_1, below, then this sensor can be used outside as well,
but with a different LOCAL_NAME, say W_2
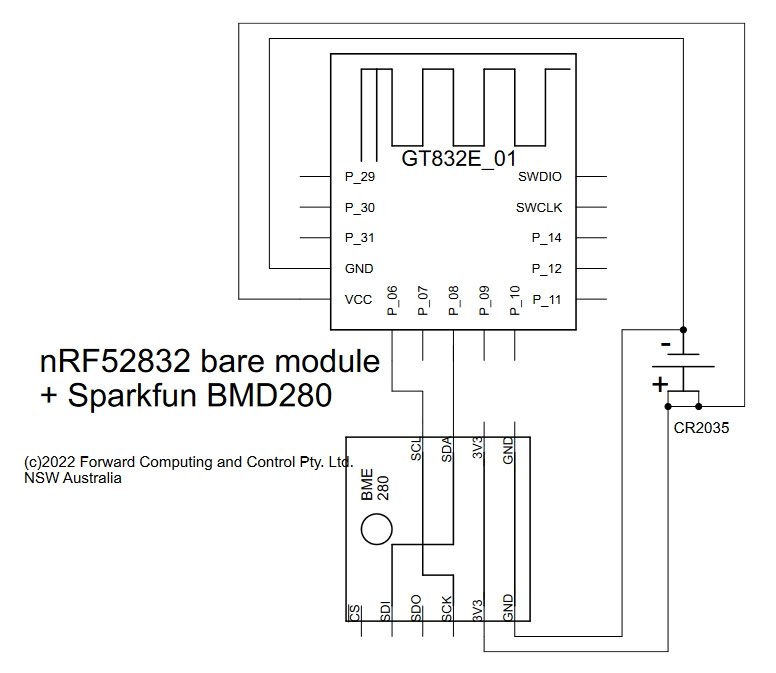
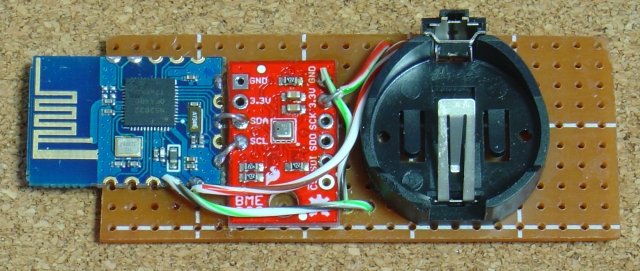
This sensor, named W_1, is programmed with the
lp_BLE_GT832E_01_BME.ino sketch. Unzip lp_BLE_GT832E_01_BME.zip
to your Arduino sketch directory.
This sensor will run for about
4 ½ years on a CR2032 coin cell.
In preparation for a future project that will turn the hall night lights on at sunset and off at sunrise, the outside sensor used here for the Weather Station includes a light sensor, SparkFun VEML7700. Note: Cut the I2C tracks on the back of VEML7700 to disconnect the two pullup resistors. The BMD280 provides the I2C pullups.
Unzip lp_BLE_GT832E_01_BME_Lux.zip to your Arduino sketch directory.

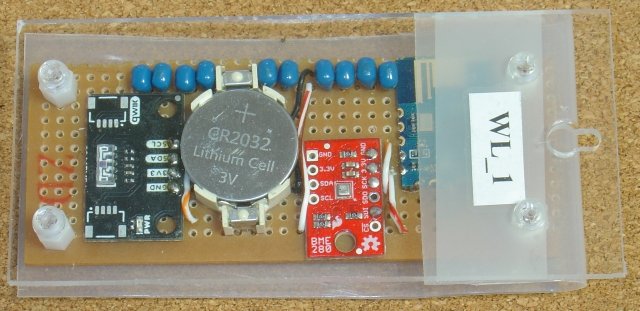
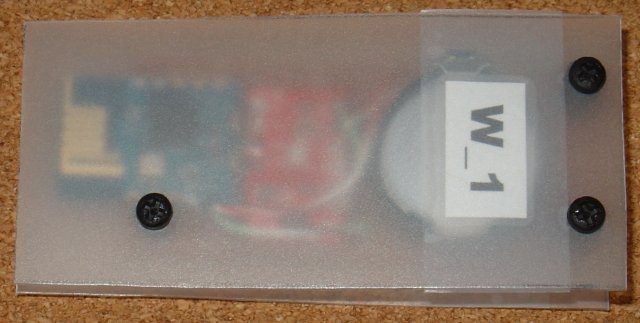
The VEML7700 light sensor has a minimum operating voltage of 2.5V. The 10 off, 22uF 16V ceramic capacitors supply the pulses of current the VEML7700 needs as the coin cell's voltage falls and its internal resistance increases. However even with these capacitors, the 2.5V cut off means a shorter effective operating life from a CR2032 coin cell, approximately 3 ¼ years. This sensor is named WL_1, following the naming convention established above. In the construction the backing plastic was folded over the top of the board to protect against dust etc settling on the circuit. The rest of the cover is open on the other 3 sides. In a more extreme climate, a more protective case would be needed.
This tutorial has presented an Indoor/Outdoor Weather Station using two very simple, very low power BLE temperature/RH/hPa sensors using only three components, a nRF52832 'bare' module a temperature/RH/hPa sensor and a coin cell. The sensors run for ~4 ½ years a CR2032 coin cell.
The display uses an old Android tablet and pfodApp. The gauges are fully customizable in the Arduino sketch. This Rev 2 add time and date and hPa plot and chart of the previous 36hrs values.
AndroidTM is a trademark of Google Inc. For use of the Arduino name see http://arduino.cc/en/Main/FAQ
The General Purpose Android/Arduino Control App.
pfodDevice™ and pfodApp™ are trade marks of Forward Computing and Control Pty. Ltd.

Contact Forward Computing and Control by
©Copyright 1996-2024 Forward Computing and Control Pty. Ltd.
ACN 003 669 994