
|
Home
| pfodApps/pfodDevices
| WebStringTemplates
| Java/J2EE
| Unix
| Torches
| Superannuation
|
| About
Us
|

|
Easy Very Low Power BLE in Arduino
|
by Matthew Ford 30th May 2022 (originally posted 15th
January 2019)
© Forward Computing and Control Pty. Ltd. NSW
Australia
All rights reserved.

Update: 30th April 2022 - This
project is superseded by A
Very Simple, Very Low Power Temperature Monitor which uses
currently available nRF52832 modules, is much simpler just the
nRF52832 module and a coin cell and lasts longer.
Update: 23rd
November 2020 – First
replacement of 2 x AAA batteries since 15th
January 2019 i.e. 22months for
2xAAA Alkaline
Update: 7th
April 2019 – Rev 3 of
lp_BLE_TempHumidity, adds Date/Time
plots,
using pfodApp V3.0.362+, and
auto throttling when sending data
Update: 24th
March 2019 – Rev 2 of
lp_BLE_TempHumidity, adds more plot options and i2c_ClearBus
This tutorial, A Very Low Power Temperature Humidity Monitor, is Part 2 of 3.
Part
1 – Building
Very Low Power BLE devices made Easy with Arduino
covers
settting up Arduino to code nRF52 low power devices, the programming
module and measuring the supply current. It also covers specialized
low power timers and comparators and debounced inputs and using
pfodApp to connect to and control the nRF52 device.
Part
2 – A
Very Low Power Temperature Humidity Monitor,
this one, covers using a Redbear Nano V2 module and an Si7021
temperature/humidity sensor to build a low power battery / solar
monitor. It also covers modifying the Si7021 library to be low power,
tuning the BLE device to reduce its current consumption of <29uA
and designing a custom temperature/humidity display for your
mobile.
Part
3 – A
Redbear Nano V2 Replacement covers
using other nRF52 based modules instead of the Nano V2. It covers
selecting supply components, construction, removing the nRF52 chip
programming protection, using NFC pins as normal GPIO, and defining a
new nRF52 board in Arduino.
This tutorial is a practical application of Part 1 Building Very Low Power BLE devices made Easy with Arduino by constructing a Very Low Power BLE Temperature and Humidity Monitor. The monitor will run for years on Coin Cell or 2 x AAA batteries, even longer with solar assist. This tutorial covers tuning the BLE parameters for low power consumption and how to power you device from battery OR battery + solar OR solar only.
As well as displaying the current temperature and humidity, the monitor stores the last 24 Hrs of 9min interval readings and the last 7 days of 27min interval readings. These can be charted on the your Android mobile against date and time and the values saved to a log file. No Android Programming is required, pfodApp handles all of that. The Android display and charting is completely controlled by your Arduino sketch so you can customize it as required. The latest version of pfodApp (V3.0.362+) can the plot the data against date and time using just the Arduino millis(). See Arduino Date and Time using millis() and pfodApp
A Redbear Nano V2 board is used for the nRF52832 BLE component and a Sparkfun Si7021 breakout board is used for the Temperature / Humidity Sensor. A modified low power library is used with the Si7021. A small PCB was designed to hold the NanoV2 and supply components. However since there are no surface mounted components used, you can just as easily build this on vero board.
Three power supply versions are covered. i) Battery plus Solar assist, ii) Battery Only, iii) Solar Only. The Solar Only option does not have any battery storage and so will only run when there is some light. A bright room light or desk lamp is sufficient.
This
project has 4 relative independent parts:-
Component
Selection and Construction
Code – Low
Power Sensor Library, User Interface and Arduino Sketch
Measuring
Supply Current and Battery Life
Supply
Alternatives – Solar Assist, Battery Only, Solar Only
As mentioned in Part 1 – The trick to getting a really low power solution is to do nothing most of the time, minimize the current through external pull-up/pull-down resistors on inputs and don't have any extra components. This project will use each of those tricks to get a low power solution.
The nRF52832 chip can run with a power supply of between 1.7V and 3.6V (absolute max voltage 3.9V). This means you could power the chip directly from a coin cell or 2 x AAA batteries. However it is prudent to add a voltage regulator to protect the chip from over volts. This extra component comes with a power cost, but in the case of the NanoV2 board the on-board regulator, TLV704, consumes less than 5.5uA max, typically only 3.4uA. For this small extra power usage you get protection for up to 24V supply inputs.
The Si7021 sensor itself draws typically <1uA when not taking a measurement, i.e. in Standby, and up to 4mA when transmitting the data via I2C. Since we don't take measurement continually, the 4mA is not a significant part of the average supply current. Taking a reading very 30 seconds adds less then 1uA to the average supply current, see the supply current measurements below.
There are two readily available Si7021 breakout boards. One from Adafruit and one from Sparkfun. A quick glance at the two boards will tell you that the Adafruit board has many more components than the Sparkfun board, so you would be inclined chose the Sparkfun board. Looking at the schematics for each board shows that the Sparkfun board is just the bare sensor and two 4k7 pullup resisotors, while the Adafruit board has an on-board, MIC5225, regulator which typically draws 29uA all the time. This is significant when the over all current for rest of circuit is <30uA. Since we already have a regulator for the nRF52832 chip, this extra component is not needed and the Si7021 can be powered from that 3.3V supply. So this project will use the Si7021 breakout board from Sparkfun.
minimize the current through external pull-up/pull-down resistors on inputs
The 4K7 I2C pullup resistors are not particularly high value and will draw 0.7mA when pulled low. This would be a problem if they where on a switch input that was grounded for long periods. However in this project the current through these resistors is minimized by only using the I2C interface infrequently and for only a short time. Most of the time the I2C lines are not in use and are high / tri-state so no current flows through these resistors.
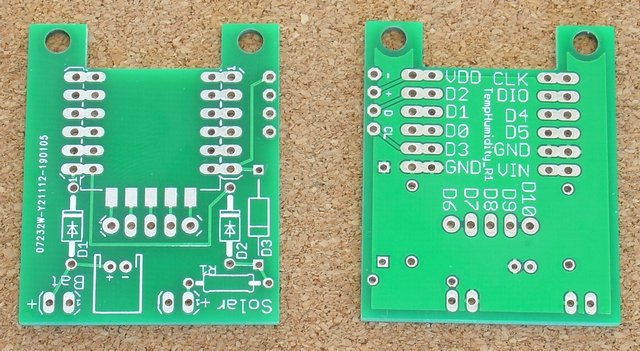

The project is constructed on a small PCB, but since there are no SMD components, it can be just as easily be built using vero board. The PCB was manufactured by pcbcart.com from these Gerber files, TempHumiditySensor_R1.zip The PCB is general purpose enough to be used for other BLE projects.
This is the schematic (pdf version)

Approximate cost per unit as at Dec 2018, ~US$62, excluding shipping and the programmer from Part 1
Redbear
NanoV2 ~ US$17
Sparkfun
Si7021 breakout board ~US$8
2 x 53mm x 30mm 0.15W 5V solar
cells e.g. Overfly
~US$1.10
1 x PCB TempHumiditySensor_R1.zip
~US$25 for 5 off www.pcbcart.com
OR Vero board (strip copper) e.g. Jaycar
HP9540 ~AUD$5
2
x 1N5819 schottky diodes e.g. Digikey
1N5819FSCT-ND ~US$1
1 x 470R 0.4W 1% resistor e.g. Digikey
BC3274CT-ND ~US$0.25
6 x 6 pin male header pins e.g. Sparkfun
PRT-00116 ~US$1.5
female to female jumper e.g. Adafruit
ID: 1950 ~US$2
3mm x 12mm nylon screws, e.g. Jaycar
HP0140 ~AUD$3
3mm x 12mm nylon nuts, e.g. Jaycar
HP0146 ~AUD$3
Scotch Permanent Mounting Tape Cat 4010 e.g.
from
Amazon ~US$6.6
AAA x 2 battery holder, e.g. Sparkfun
PRT-14219 ~US$1.5
2 x AAA 750mA Alkaline batteries, e.g.
Sparkfun
PRT-09274 ~US$1.0 These batteries should last >2yrs. Energizer
Alkaline Batteries have higher capacity
Plastic Box (ABS) 83mm x
54mm x 31mm, e.g. Jaycar
HB6005 ~AUD$3
pfodApp
~US$10
1 x 22uF 63V Low ESR Capacitor (Optional) e.g. Jaycar
RE-6342 ~AUD$0.5 or Digikey
P5190-ND ~US$0.25
The
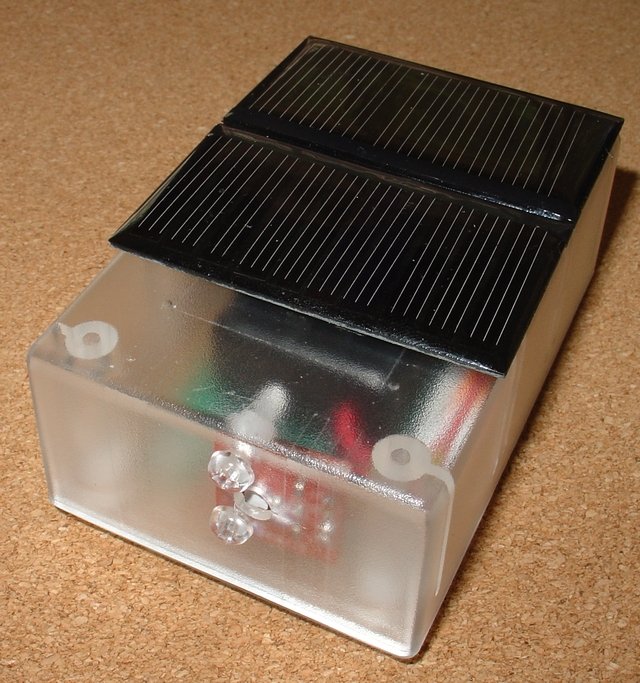
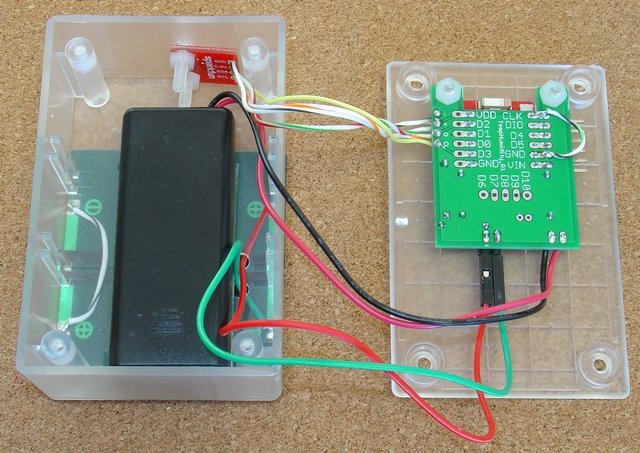
construction is straight forward. The battery holder and the solar
cells are secured to the plastic box with heavy duty double sided
tape.
Note the Gnd link wire from the CLK to
GND in the finished part. This is installed AFTER programming to
prevent noise on the CLK input from triggering the nRF52 chip into a
high current debug mode.
Download the zipped code, lp_BLE_TempHumidity_R3.zip, and unzip it to your Arduino Sketches directory. You also need to install the lp_So7021 library from this zip file and also install the pfodParser library.
Both Adafruit and Sparkfun provide support libraries to access the Si7021 sensor, however both those libraries are unsuitable for very low power use. The both use a delay(25) in the code to delay reading the sensor while it is taking its measurement. As noted in Part 1 Delays are Evil. The Arduino delay() just keeps the micro-processor running using power while it waits for the delay to time out. This breaks the first rule of low power BLE, do nothing most of the time. The replacement lp_Si7021 library, replaces all delays with lp_timers which put the micro-processor to sleep while waiting for the sensor to finish its measurement.
How much difference does the lp_Si7021 library make? Using the original SparkFun Si7021 support library and taking one reading a second without any Serial prints, draws ~1.2mA average. Replacing the Sparkfun library with the lp_Si7021 library reduces the average current to ~10uA, i.e. 100 times less. In this project the fastest measurement rate is once every 30 seconds when the mobile is connected, which results in an average sensor current of less than 1uA. When there is no BLE connection the measurement rate is once every 10 mins and the average sensor supply current is negligible.


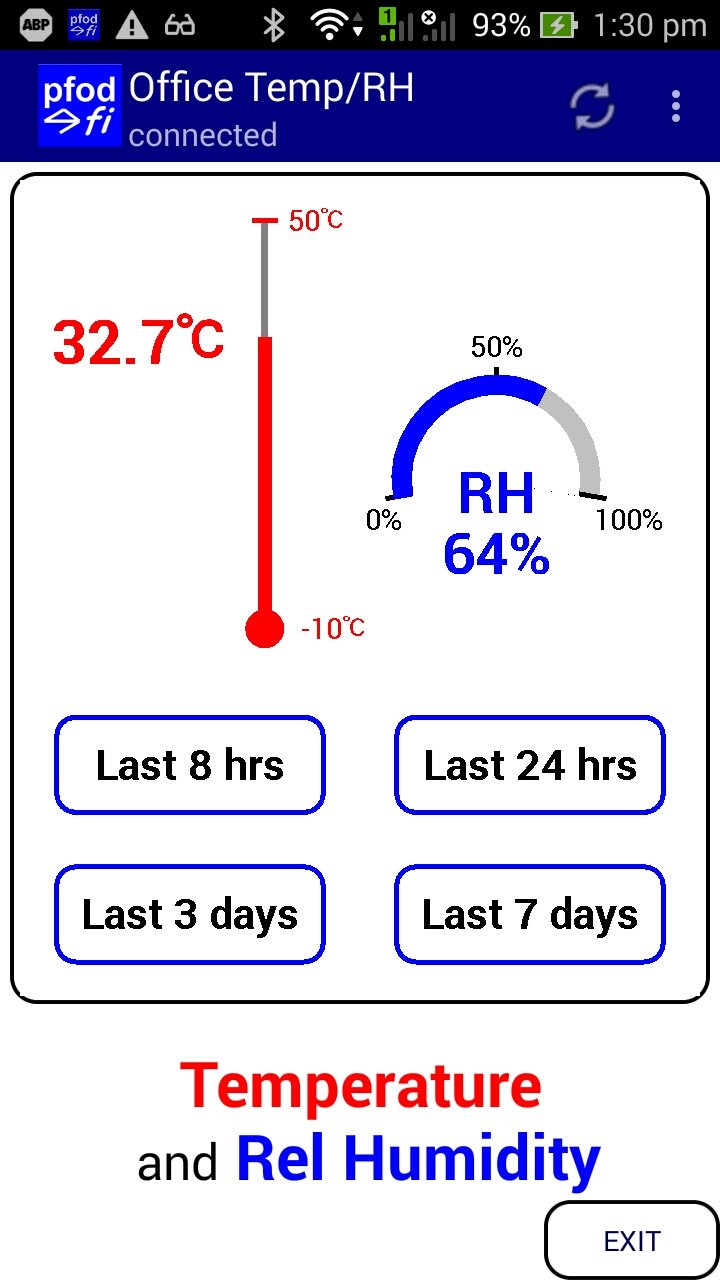
Above is the main screen display and two of plot options. These plots show the historical data stored in the TempHumidity module. They can also be zoomed and panned in both directions, using two fingers.
The user interface is coded in the Arduino sketch and then sent to pfodApp on the first connection where is it cached for repeated use and updates. The graphical display is built from drawing primitives. See Custom Arduino Controls for Android for a tutorial on how to build your own controls. The Thermometer, RHGauge and Button files contain the drawing commands for those items.
Note: None if this display is built into pfodApp. The entire display is completely controlled by the code in your Arduino sketch.
The sendDrawing_z() method in thelp_BLE_TempHumidity_R3.ino sketch defines the user interface.
void sendDrawing_z() {
  dwgs.start(50, 60, dwgs.WHITE); // background defaults to WHITE if omitted i.e.  start(50,60);
  parser.sendRefreshAndVersion(30000); // re-request dwg every 30sec sec. this is ignored if no parser version set
  // touch above buttons to force display updates
  dwgs.touchZone().cmd('u').size(50, 39).send();
  dwgs.pushZero(35, 22, 1.5); // move zero to centre of dwg to 35,22 and scale by 1.5 times
  rhGauge.draw(); // draw the control
  dwgs.popZero();
  dwgs.pushZero(18, 33); // move zero to centre of dwg to 18,33 scale is 1 (default)
  thermometer.draw(); // draw the control
  dwgs.popZero();

  dwgs.pushZero(12.5, 43, 0.7); // move zero to centre of dwg to 12.5,43 and scale by 0.7
  hrs8PlotButton.draw(); // draw the control
  dwgs.popZero();
  dwgs.pushZero(37.5, 43, 0.7); // move zero to centre of dwg to 37.5,43 and scale by 0.7
  days1PlotButton.draw(); // draw the control
  dwgs.popZero();

  dwgs.pushZero(12.5, 54, 0.7); // move zero to centre of dwg to 12.5,54 and scale by 0.7
  days3PlotButton.draw(); // draw the control
  dwgs.popZero();
  dwgs.pushZero(37.5, 54, 0.7); // move zero to centre of dwg to 37.5,54 and scale by 0.7
  days10PlotButton.draw(); // draw the control
  dwgs.popZero();
  dwgs.end();
}
The pushZero commands change the origin and scaling for drawing the next component. This lets you easily change the size and position of the buttons and gauges.
On the first connection the initial display takes 5 or 6 sec to down load the ~800 bytes that define the display. pfodApp caches the display so future updates only need to send the changes, gauge positions and readings. These updates only take a couple of seconds to send the 128 bytes need to update the display.
There are five (5) active touch zones defined in the
display. Each button has one defined in its draw() method, so
you can click on it to open the respective plot, and the top half of
the screen is configured as the third touch
zone
dwgs.touchZone().cmd('u').size(50,
39).send();
When you click on screen above the
buttons, the 'u' dwg command is sent to your sketch to force a new
measurement and screen update. Normally when connected, updates only
happen every 30sec. Each click or refresh of the drawing forces a new
measurement. The response from the Arduino sketch to pfodApp is
delayed until the new measurement is completed (~25ms) so that the
latest value can be sent in the update.
The Arduino Sketch, lp_BLE_TempHumidity_R3.ino, is an enhanced version of the example sketch used in Part 1. The lp_BLE_TempHumidity_R3.ino sketch replaces the menu with the drawing shown above. It also adds the lp_Si7021 sensor support and data arrays to store the historical measurements.
The main complication in thelp_BLE_TempHumidity_R3.ino sketch is to handle sending the plot data. As the measurements are made readRHResults() handles collecting the results and saving them to the historical arrays. The arrays are 120 long but when the data is sent the first 30 data points are for at a finer time interval.
There are a few points need to take care of when sending the plot points to display :-
Each data point is ~25 bytes long, in CSV text format. So 150 points is 3750 bytes of data. The lp_BLESerial class has a 1536 byte buffer, 1024 of which is large enough for the largest pfod message. The other 512 bytes is reserved for sending the data. Once the historical data has filled up the 512 bytes, sending further data is delayed until there space in the buffer.
To avoid the plot data slowing down the main display updates, the plot data is only sent while the plot screen is displayed. Once the user switches back to the main screen, sending the plot data is paused. Sending the plot data is resumed when the user clicks the plot button to display the plot again.
The historical plots start from 0 (now) and go backward in time. If there has been no new measurement since the last plot was displayed, the previous data that was already downloaded is just displayed again immediately. If there is a new measurement. Then it is added to the previous plot data.
When the monitor is first powered up, there are no historical readings and 0 is stored in the arrays as an invalid reading. When the plot is displayed, invalid readings are just skipped, resulting in a shorter plot.
The lp_BLE_TempHumidity_R3.ino sketch displays and
plots the data in Celsius. To convert the results to Fahrenheit
replace the all occurrences of
parser.print(sensor.Temp_RawToFloat(
..
with
parser.print(sensor.CtoF(sensor.Temp_RawToFloat(
…
And replace the unicode degC symbol in
Octal \342\204\203 with the degF symbol \342\204\211
pfodApp will display any Unicode you mobile can
display. See Using
Non-ASCII chars in Arduino for more details. Also change the
MIN_C, MAX_C settings in Thermometer.h. Finally adjust the plot
limits as you wish e.g. change
|Temp
C~32~8~deg C|
to say
|Temp
F~90~14~deg F|
Using the lp_Si7021 library, even taking a temperature/humidity measurement every 10 secs only contributes ~1uA to the average supply current, so the main factor in the supply current and hence battery life is the current used by the BLE advertising and connection and data transmission.
Connect the Temperature/Humidity board to the Programmer described in Part 1 as shown below.
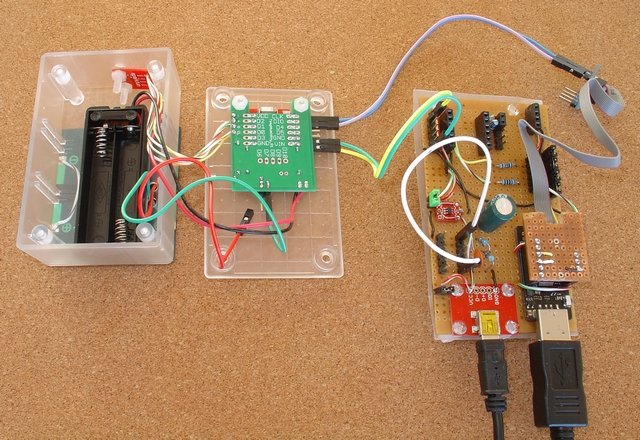
With the solar cells and batteries unplugged, Vin and Gnd are connected to the programmer's Vdd and Gnd (the Yellow and Green leads) and the SWCLK and SWDIO are connect to the Clk and SIO of the programmer header board (the Blue and Pink leads)
You can now program NanoV2 and measure the supply current as described in Part 1.
Install the low power Si7021 library from this zip file, lp_Si7021.zip and install the pfodParser library and unzip lp_BLE_TempHumidity_R3.zip to your Arduino sketches directory and program the Temp/Humditiy board with lp_BLE_TempHumidity_R3.ino
As mentioned above the contribution of the sensor is <1uA, average, at the highest measurement rate used in this project, so the BLE advertising and connection parameters are the determining factor for battery life.
The BLE advertising and connection parameters that effect current consumption are :-Tx Power, Advertising Interval, Max and Min Connection Intervals, and Slave Latency.
Note: Using the connections above there are two (2) regulators in the supply, one on the NanoV2 board via Vin and the MAX8881 on the programmer's supply. This means the measured supply currents will be ~5uA higher than actual, due to the second regulator. The values quoted below are the measured currents minus this extra 5uA.
Tx Power effects supply current both when connected
and when advertising (not-connected). This project uses the maximum
power setting (+4) and provides the best range and greatest noise
immunity for the most reliable connections. You can use the
lp_BLESerial setTxPower( ) method to change the power setting.
Valid values are, in increasing power, -40, -30, -20, -16, -12, -8,
-4, 0 +4.
You must call the lp_BLESerial begin() method
BEFORE you call setTxPower(). See
thelp_BLE_TempHumidity_R3.ino sketch.
You can experiment with reducing the Tx Power, but the compromise is short range and more connection drop outs due to interference. In this project the Tx Power is left at its default, +4. As you will see below, even with this setting, very low supply current are still possible.
For a given Tx Power, when there is no connection, the Advertising Interval sets the average current consumption. The recommended range is 500 to 1000ms. Here 2000ms was used. The compromise is that longer advertising intervals means it is slower for your mobile to find the device and set up a connection. Internally, advertising intervals are set in multiples of 0.625ms in the range 20ms to 10.24sec. The lp_BLESerial setAdvertisingInterval( ) method takes ms as the argument, for convenience.
For +4 TxPower and 2000ms advertising interval the current consumption was ~18uA. For 1000ms advertising interval, it was ~29uA. Rev 2 used 2000ms advertising interval but this resulted in slow connections. Rev 3 changed to 1000ms advertising interval to make connections faster.
Once a connection is established, the connection interval determines how often the mobile contacts the device. The lp_BLESerial setConnectionInterval() lets you set the suggested max and min, however the mobile controls what the connection interval actually is. For convenience the arguments to setConnectionInterval() are in ms, but internally the connection intervals are in multiple of 1.25ms, in the range 7.5ms to 4sec.
The default setting is setConnectionInterval(100,150) i.e. min 100ms to max 150ms. Increasing these values reduces the supply current while connected, but the compromise is slower transmission of data. Each update of the screen takes about 7 BLE messages, while a full 36hrs of 10min measurements takes about 170 BLE messages. So increasing the connection intervals slows down the screen updates and the plot displays.
The lp_BLESerial class has a 1536 byte send buffer and only sends one block of 20 bytes from this buffer, each max connection interval to prevent flooding the BLE link with data. Also when sending plot data, the sketch only sends data until 512 bytes are waiting to be send then then delays sending more data until some data has been sent. This avoids flooding send buffer. This throttling of the sends makes the data transmission to the mobile reliable, but it is not optimized for maximum through put.
In this project the connection intervals were left as the default values.
When there is no data to send to the mobile, the device can optionally ignore some of the connection messages from the mobile. This saves Tx Power and supply current. The Slave Latency setting is the number of connection messages to ignore. The default is 0. The lp_BLESerial setSlaveLatency() method can be used to change this setting.
The default Slave Latency of 0 gave ~50uA supply current, ignoring the screen updates every 30 secs, but including the keepAlive messages very 5 secs. Setting the Slave Latency to 2 gave an average connected supply current of ~25uA. A Slave Latency setting of 4 gave ~20uA. Higher settings did not seem to reduce the supply current so a Slave Latency setting of 4 was used.
When connected, every 30 secs pfodApp requests an display update. This forces a sensor measurement and sends back data to update the graphical display. This update results in an extra ~66uA for 2 secs each 30 secs. That is an average of 4.4uA over the 30 secs. Adding this to the 20uA, gives an average connection supply current of ~25uA
Using the settings
above, as set in lp_BLE_TempHumidity_R3.ino, the Total Supply current
when Connected and updating the display every 30 secs, approximately
25uA. When not
connected it is approximately 29uA.
For calculating battery life a continual current draw of ~29uA is
assumed.
Various batteries have difference capacities and voltage characteristics. The batteries considered here are CR2032 coin cell, CR2450 (N) coin cell, 2 x AAA Alkaline, 2 x AAA Lithium and LiPo.
If using Solar Assist then add 50% to these
battery life figures (assuming 8hr a day light)
Note: The 22uF
LowESR capacitor ( C1 ), in addition to the on board NanoV2 22uF
capacitor, stores the Solar Cell current and then supplies it for the
TX current pulses. Other wise the battery supplies some of the TX
current. This extra 22uF LowESR adds about 10% to the battery current
when the solar cell is not the supply, but also extends the battery
life by compensating for the rising battery internal resistance as
the battery reaches end of life. The measurements below were taken
WITHOUT the additional 22uF capacitor.
CR2032 – 235mAHr –
battery life 10 months
CR2450 (N) – 650mAHr (540mAHr)–
battery life 2.3 yrs (2yrs)
2 x AAA Alkaline – 1250mAHr –
battery life 3.8.yrs
2 x AAA Lithium – 1200mAHr –
battery life 4.7 yrs
LiPo rechargable – not recommended due
to high self-discharge.
This coin cell has capacity of typically 235mAHr (Energizer Battery), a nominal voltage of 3V and a specified discharge voltage of 2V. This implies a battery life of 8100hrs or ~0.9yr. However the internal cell resistance increases as the battery reaches end of life and so may not be able to provide the peak Tx current pulses. A larger supply capacitor can be used to reduce this effect, but say 10 months life.
This coin cell has capacity of typically 620mAHr (540mAHr for CR2450N), a nominal voltage of 3V and a specified discharge voltage of 2V. This implies a battery life of 22,400hrs or ~2yr 6m (18600hrs ~2yrs 2m for CR2450N). However the internal cell resistance increases as the battery reaches end of life and so may not be able to provide the peak Tx current pulses. A larger supply capacitor can be used to reduce this effect, but say 2yr 4m (2yr N) life.
Note: The CR2450N version has a thicker lip which helps prevent incorrect installation in a CR2450N holder. You can insert a CR2450N and CR2450 cell in a CR2450 holder but you cannot insert a CR2450 cell in a CR2450N holder.
These batteries have a capacity of about 1250mAHr (Energizer Battery) for very low currents, a nominal voltage of 2x1.5V = 3V and a specified discharge voltage of 2x0.8V = 1.6V. But this specified discharge voltage is less than the operating voltage of the Si7021 sensor (1.9V) so the battery can only be used down to ~1V each. This reduces the capacity by about 10% to 15% i.e. ~1000mAHr.
This implies a battery life of 34,500hrs or ~4yr. However the internal cell resistance increases as the battery reaches end of life and so may not be able to provide the peak Tx current pulses. A larger supply capacitor can be used to reduce this effect, but say 3yrs 10m life. Note Alkaline batteries have a self discharge of 2% to 3% per year.
These batteries have a capacity of about 1200mAHr (Energizer Battery), a nominal voltage of 2x1.7V = 3.4V, at low currents, and a discharged voltage of 2x1.4V = 2.4V. This implies a battery life of 41,400hrs or 5yrs.
These batteries come in various capacities from 100mAHr to 2000mAHr, in flat formats, and have a charged voltage of 4.2V and a discharged voltage of >2.7V. However they have a high self-discharge of 2%-3%/month (i.e. 24% to 36% per year) and so are not as suitable for this application as the other batteries.
The construction above uses the Battery plus Solar Assist supply. When the solar panels generate more voltage than the battery voltage, the solar cells will power the monitor, so extending the battery life. Typically the battery life can be extended by another 50%.
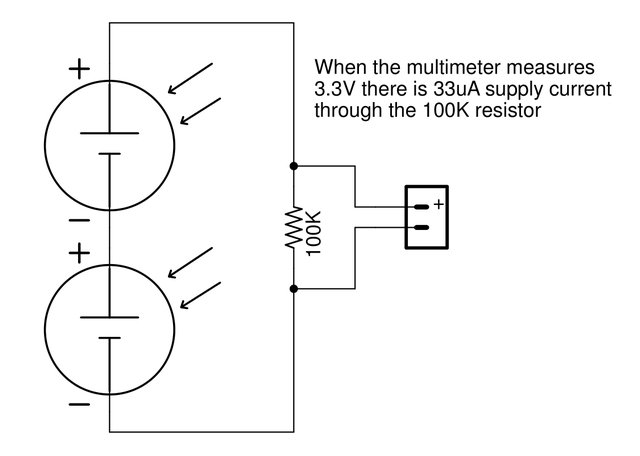
The solar panels used are small, 50mm x 30mm, cheap, ~$0.50, and low power. They are nominally 5V panels, but need full direct bright sunlight to generate 5V. In this project two panels are connected in series so that placing the monitor some where near a window, out of direct sun, is sufficient to power replace the battery power. Even well lit room, or a desk lamp, is enough for the solar cells to generate >3.3V at >33uA and take over from the battery.
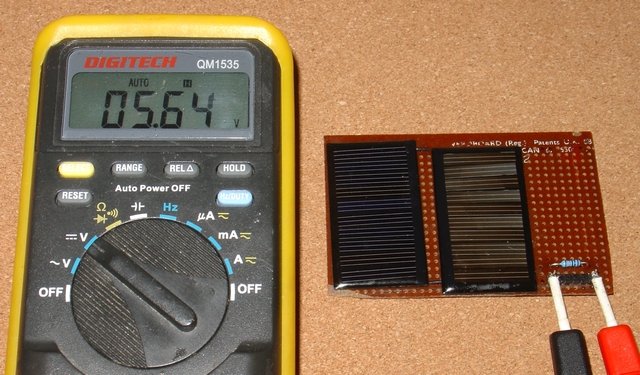
A simple test panel was constructed to determine where the Temperature / Humidity Monitor could be placed, out of the sun and still be solar powered. As you can see from the photo below, the two panels connected to a 100K resistor are producing 5.64V across the 100K, i.e. 56uA current at 5.64V. This is more than sufficient take over powering the monitor from the battery. Any voltage reading above the nominal battery voltage of 3V means the solar cells will be powering the monitor instead of the battery.
The two diodes in the Temperature Humidity Monitor circuit isolate the solar cells and the batteries from each other and guard against connecting them in reverse polarity. The 10V 1W zener and 470R series resistor protects the NanoV2's on-board regulator from over voltage from two solar cells in full sun, particularly if 12V cells happen to be used instead of 5V ones. In normal operation at <5V, the 10V zener only draws ~1uA.

For a Battery Only Supply, just omit R1, D1 and D3 and the solar cells. You can also replace D1 with a piece of wire if you don't want reverse polarity protection.
Powering the monitor from Solar Cells only, with no battery, requires a different power supply circuit. The problem is that while the monitor will operate on 29uA, on power up the nRF52 draws ~5mA for 0.32 sec. The circuit shown here (pdf version) holds the MAX8881 regulator off until the input capacitors, 2 x 1000uF, charge up to 4.04V. Then the MAX6457 releases the MAX8881 SHDN input to power up the nRF52 (NanoV2) The 2 x 1000uF capacitors supply the necessary start up current.

This lets the monitor power up as soon as there is enough solar power keep it running at 29uA.
This tutorial has presented a battery/solar powered Temperature Humidity Monitor as an example very low power BLE project in Arduino for the nRF52832 chip. Supply currents of ~29uA where achieved by tuning the connection parameters. This resulted a CR2032 coin cell battery life ~10months. Longer for higher capacity batteries. Adding two cheap solar cells easily extended the battery life by 50% or more. A bright room light or a desk lamp is sufficient to power the monitor from the solar cells.
A special power circuit was presented to allow the monitor to be run purely from low capacity solar cells.
The free pfodDesigner lets you design menus/sub-menus, plot against date/time and log data and then generate the low power Arduino sketch for you. Here a custom interface was coded using pfodApp drawing primitives. Connecting with pfodApp displays the user interface and updates the readings while the monitor is using ~29uA
No Android programming is required.
pfodApp handles all of that.
AndroidTM is a trademark of Google Inc. For use of the Arduino name see http://arduino.cc/en/Main/FAQ
The General Purpose Android/Arduino Control App.
pfodDevice™ and pfodApp™ are trade marks of Forward Computing and Control Pty. Ltd.
Contact Forward Computing and Control by
©Copyright 1996-2020 Forward Computing and Control Pty. Ltd.
ACN 003 669 994