
|
Home
| pfodApps/pfodDevices
| WebStringTemplates
| Java/J2EE
| Unix
| Torches
| Superannuation
| CRPS Treatment
|
| About
Us
|
|
|
Protecting Your Superannuation
|
by Matthew Ford 8th Nov 2025 (first posted 17st
September 2009)
© Forward Computing and Control Pty. Ltd.
NSW Australia
All rights reserved.
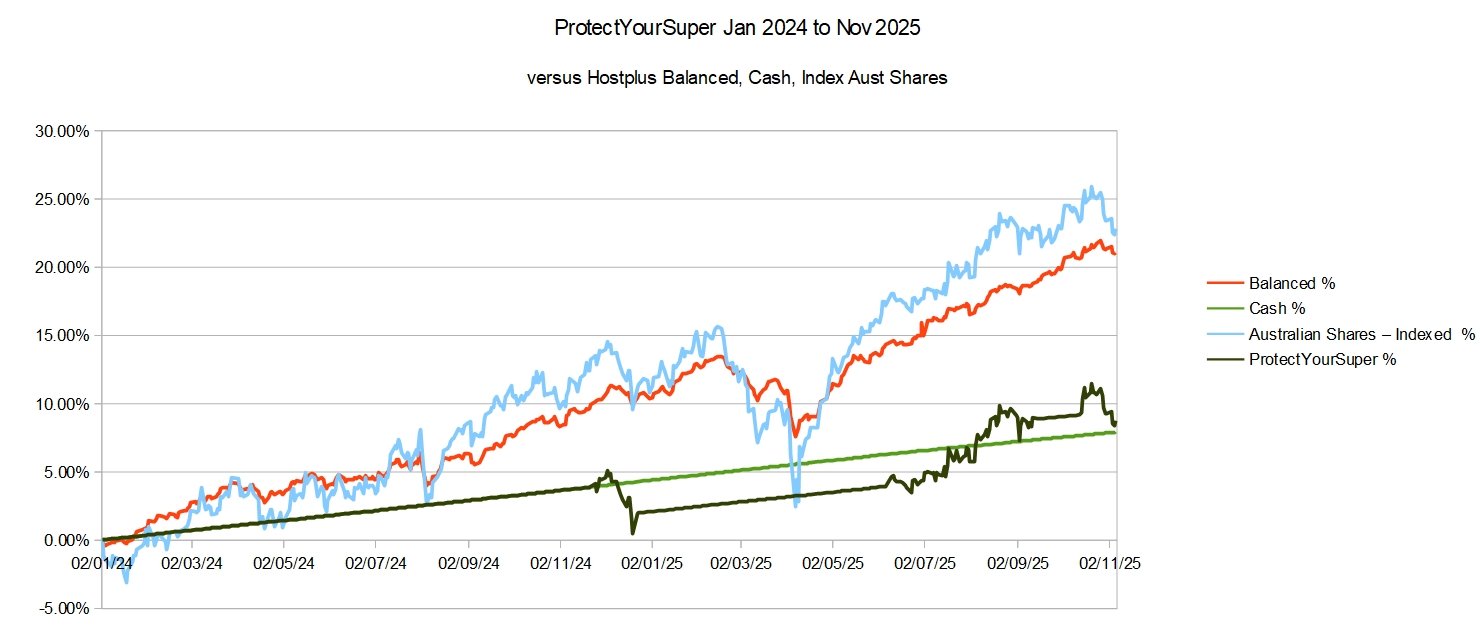
RiskYourSuper is more suited to a low interest rate environment than ProtectYourSuper. Currently it appears we are in higher interest rate environment so ProtectYourSuper is more appropriate. It remains to be seen if these higher interest rates are maintained in the longer term. See the Commentary below and the previous commentaries
Legal Disclaimer: I do not hold a Financial Advisor’s Licence and nothing in this article should be considered as recommending any particular course of action to anyone else.
ProtectYourSuper is currently indicating a switch to Cash. The performance over the last two (2) years has not been noticeable better than cash. See the chart below
Introduction
Download
the Free Software (runs on Windows, Mac, Linux, Solaris)
Results
for AustralianSuper funds since 1st
July 2008
Summary
of Results
Conclusion

The
previous version of the software is
ProtectYourSuper2_3_1.jar
and
pdf
documentation.
Super got a lot of bad press after the 2008 GFC. Many people have seen the value of their nest egg drop dramatically. But it is not the Superannuation system that is the problem, rather it is where your money has been invested that has lead to the drop in value.
Many people are in the ‘default’ Balanced option that has a large exposure to the share market. This is good if the market is going up but not so good when it is going down. This article describes the simple steps I use to take back control of my super, stop the drop in value when the share market falls and still reap the rewards when it rises. I spend no more that a few minutes each week on it and I did it without starting my own super fund. I have been doing this method since 2010 using a variety of method, the latest being this one. For a discussing of the background to RiskYourSuper see this page.
Here is a comparison of RiskYourSuper/ProtectYourSuper versus AustralianSuper Balanced and AustralianSuper Australian Shares funds. The returns for all three, over the last 11 years, has averaged between 6.9% to 8.3% but as the following chart shows, the variation from year to year is markedly different. The blue squares show the average return, while the vertical bars show the range of returns over the years.

Of the three ways of
investing your superannuation, ProtectYourSuper has so far shown the
least variation in returns from year to year. ProtectYourSuper gives
me more confidence in planning my financial future.
I have made a program available which process the downloaded share index data and does the calculations for the three rules used in this method and advises me on when to switch. The program runs on Windows, Mac, Linux and Solaris. Installation and running documentation in pdf format is also available. This program also assists in starting to use the method by suggesting when to start switching. See the pdf documentation for details.
Before discussing the method in detail, let’s look at how it would have worked since 1st July 2008 (the earliest date AustralianSuper provides detailed data for).

The
Green line is the RiskYourSuper/ProtectYourSuper performance
switching method described switching between 100% 'shares' and 100%
'Cash' alternative.
The Blue line is the AustralianSuper's Share fund performance. The Red line is the AustralianSuper's Balanced fund performance. The Yellow (bottom) line indicates when the switches were made for the top Green line. It is high when 100% of the money is in Shares. These graphs were drawn using the data available on the AustralianSuper's web site.
The results shown here are for ProtectYourSuper using 11/33 values switching between AustralianSuper Shares and Cash between 1st July 2008 and 28th Dec 2011. Then between 28th Dec 2011 and 1st August 2012 I switched between AustralianSuper Shares and Fixed Interest. From 1st August 2012 to 2nd June 2014, the switches were between AustralianSuper Shares and DiversifiedFixedInterest. From 2nd June 2014 to 14th Jan 2019, the switches were between AustralianSuper Shares and Property (except for 26th August 2015 to 12th Oct 2015 and 11th Oct 2018 to 14th January 2019, when I switched to AustralianSuper Cash as a safety precaution). From 11th February 2020 the switches are between Hostplus Australian Shares and Hostplus Property Fund, except that the latest switch on 29th February 2020 was to 100% pure Cash Fund (Hostplus Cash Fund) as a safety precaution. From 30th June 2020 I switched to using RiskYourSuper V1.0.0
RiskYourSuper currently switches between Hostplus Balanced Shares and Hostplus Cash. RiskYourSuper stays in Balanced until the share market drops by more than 10% from its last peak. Then RiskYourSuper switches to Cash until the 99 day SMA line turns up (on a weekly basis)
This summary is mainly ProtectYourSuper which I was using for the last 10years. The RiskYourSuper results take over from 30th June 2020.
Having convinced myself that this switching method performed well, I started using it in Oct 2010 with moving average values of 15 and 30. Prior to Oct 2010 I used other versions of this switching method, see Background to Protecting your Superannuation for more details. On 15th January 2012 I made a small adjustment to the moving average values I used changing them to 11 and 33. On 22nd November 2012 I revised the definition of profit in Rule 3 which resulted in noticeable improvements in the results. On 7th April 2020 I revised Rule 3 to ignore the last switch's profit/loss if the market had fallen by >10% which showed ~10% improvement on back testing since 2008.
The results shown here are for the 11/33 values switching between
AustralianSuper Shares and Cash between 1st July 2008 and
28th Dec 2011. Between 28th Dec 2011 and 1st
August 2012 I switched between AustralianSuper Shares and Fixed
Interest. From 1st August 2012 to 2nd June
2014, the switches were between AustralianSuper Shares and
DiversifiedFixedInterest. From 2nd June 2014 the switches
were between AustralianSuper Shares and Property, except
for 26th August 2015 to 12th Oct 2015 when I
switched to AustralianSuper Cash as a safety precaution. From 11th
February 2020 the switches are between Hostplus Australian Shares and
Hostplus Property Fund, except that the latest switch
on 29th February 2020 was to 100% pure Cash Fund (Hostplus
Cash Fund) as a safety precaution.
From 30th June 2020
I switched to RiskYourSuper. Currently RiskYourSuper switches between
Hostplus Australian Balanced and Hostplus Cash

So, in summary, a check of the Switching method over the last 15 years (since 4th July 2000) shows a relatively steady rise in value with low variability from year to year. However in the last few years the very low cash interest rate has held back the results prompted my move to RiskYourSuper. RiskYourSuper current switches between HostPlus Balanced and HostPlus Cash Funds.
Having used ProtectYourSuper for the last 10 years, I now find it is not effective when the interest rates are almost zero. There Is No Alternative (TINA) to shares for earning a return on your money in this economic environment. So I have replaced ProtectYourSuper with RiskYourSuper, which spends most of its time in shares and only switches to cash when the share market falls by more then 10%. have found that by selecting an appropriate super fund and using the simple rules described above, based a chart of All Ordinaries index available on the internet, that I am able to avoid heavy losses in my super over the last few years while still making gains now that the share market is recovering. I sometimes lose money switching into Shares and out again, but I catch the major rises in the market while avoiding the major falls.
Spending a few minutes once a week applying this method, lets me sleep peacefully every night when the share market goes in to a substantial decline because this method has has told me to put all my super into Cash and using this method also removes the worry about when I should put my super back into Shares as the market recovers.

Contact Forward Computing and Control by
©Copyright 1996-2024 Forward Computing and Control Pty. Ltd.
ACN 003 669 994