
|
Home
| pfodApps/pfodDevices
| WebStringTemplates
| Java/J2EE
| Unix
| Torches
| Superannuation
| CRPS Treatment
|
| About
Us
|
|
|
Protecting Your Superannuation in a Sideways Market
|
by Matthew Ford 3rd January 2013 (first posted 6th
October 2012)
© Forward Computing and Control Pty. Ltd. NSW
Australia
All rights reserved.
Legal Disclaimer: I do not hold a Financial Advisor’s Licence and nothing in this article should be considered as recommending any particular course of action to anyone else.
I have received a few emails recently concerning the operation of the ProtectYourSuper method between the beginning of the financial year and now (30th December 2012). Here is an excerpt from one such email
“I must first say that I am comfortable with the fairly conservative approach you system offers me with only a few years to retirement but, like most I suspect, often wonder what a little more risk would look like - and this brings me to my first question:
1. In the last couple of months AustraliainSuper 'Australian shares' seem to have performed consistently well according to their website. So well it just feels as if I should therefore have been seeing a 'move to shares' message on recent Saturdays when I run your latest version program, but I haven't because rule 3 says no. How well does the Oz share market need to do to get a 'move to shares' message, or rather the question is why is rule 3 saying no each week when Oz shares have performed well over a ~3 month period?”
The email goes on to ask if the current result from ProtectYourSuper program of “Stay in Cash” is correct. The answer to this is YES.
Before going into details of how ProtectYourSuper is operating in this sideways market, first lets set the background. The AustralianSuper website only shows one year at a time so while the share market results for the last 9 months look impressive, looking over a longer period gives a different picture. Here is a plot of the AustralianSuper web site of Australian Share Fund returns versus AustralianSuper Diversified Fix Interest for first 9 months of this financial year.
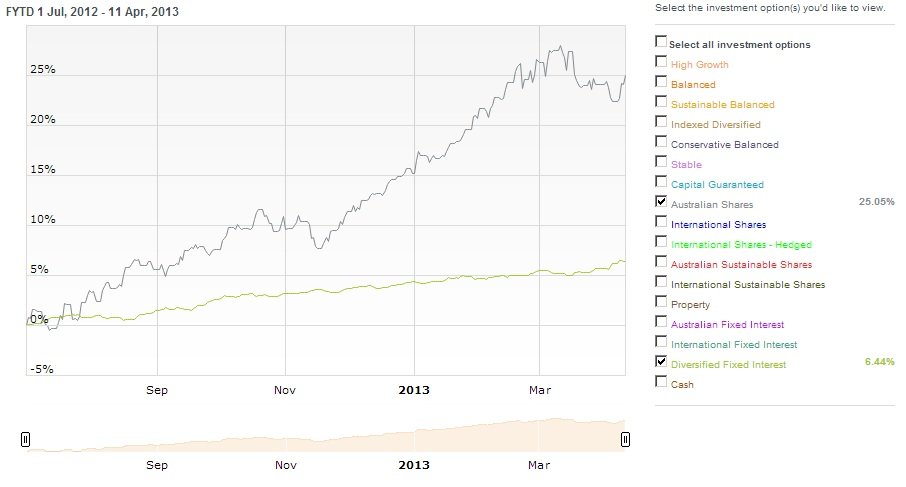
Looking at these results you can see why the question was asked. However below is a plot of the returns over a longer time period and including the ProtectYourSuper V2.1.5 results.
This plot shows that the share fund, the black line, has improved since 1st July 2012 it is currently 12.5% above its highest value in the last 4 years and ahead some 27% over the 4 ¾ years. On the other hand if you had just left your super in DiversifiedFixed Interest, the green line, you would be 16.5% better off with much less risk. Finally the ProtectYourSuper V2.1.5 method, the blue line, is some 30.6% better than shares.
Yes the program is correctly saying "Stay in Cash" and that is where my super is, in Diversified Fix Interest. From the top plot you can see that Diversified Fix Interest is up over 6% in the last 9 months with almost no risk. This would suggests a return 8% for the year. I would be very happy with that return. On the other hand the share fund is up 25%. While that return looks good by itself as you can see from the chart a lot of that rise is just recovering lost ground. There is significantly more risk in the shares return.
This still leaves the question as to why the ProtectYourSuper method is not saying to switch to Shares to try and capture some of that rise.
The basic problem is that currently we are in a sideways market. While the rise in the share market in the last 6 months looks good in isolation, you can see from the chart above that, except for the last 3 months, it is really only recovering from the last drop and has been going nowhere for years. The problem with sideways markets is that moving averages, which form the basis of the ProtectYourSuper method, don't work well. It looses money switching into and out of shares as the share index wanders up and down and, due to the inherent delay of the averaging process, it always ends up switching in high and out low and so losing money.
To avoid periods like this, when the share market is going nowhere and when moving averages consistently loose money, the ProtectYourSuper method stays in 'cash' if the last switch to shares lost money, as it did in the drop shown near the right end of the chart (last May). Although even with the loss on that switch the ProtectYourSuper method was in profit for the year.
The ProtectYourSuper method won't show a switch to shares again, after such a loss, until it has had a successful “paper trade” switch into and out of shares which made money and rule 3 becomes true again. Only then, when the moving averages have demonstrated to be working, will the ProtectYourSuper method show a switch to shares on the next upward movement. A profitable “paper trade” switch completed a few weeks ago, so ProtectYourSuper will indicate a switch to shares the next time the moving averages turn up.
A word of warning, if this sideways market continues, ProtectYourSuper may again loose money on its next switch to shares and then stay out of shares next time they go up. But in the mean time it will continue to recover these losses from the Diversified Fixed Interest gains and most importantly it will preserve my capital by switching out of shares quickly as they go down.
If you look at the left hand side of the long term chart on www.protectyoursuper.com.au you can see a similar period of a sideways market. Here is an enlarged plot of that period July 2000 to Dec 2002. The blue line is the ProtectYourSuper result. The red line is the shares index and the yellow line is high when ProtectYourSuper was 100% in shares and low when ProtectYourSuper was 100% in cash.
As you can see from this plot most of the time was spent in 'cash' and results were sometimes below those returned by shares. Further more the first two switches into shares lost money. BUT once the market put on a sustained rise, ProtectYourSuper picked it up and kept the increase even as the share market turned down again.
This plot only shows the times ProtectYourSuper said "switch to shares". Before each switch shown here there was a period, like we are are in now, where the share market was rising BUT because the last switch had lost money, ProtectYourSuper did not switch to shares.
This is what the ProtectYourSuper is designed to do. Wait out the sideways markets while preserving my capital, but participating in any sustained rises as they come along.

Contact Forward Computing and Control by
©Copyright 1996-2024 Forward Computing and Control Pty. Ltd.
ACN 003 669 994