
|
Home
| pfodApps/pfodDevices
| WebStringTemplates
| Java/J2EE
| Unix
| Torches
| Superannuation
|
| About
Us
|
|
|
Protecting Your Superannuation - Examples
|
by Matthew Ford 7th April 2020 (originally posted 24th
September 2011)
© Forward Computing and Control Pty. Ltd. NSW
Australia
All rights reserved.
This page contains as series of examples of applying my method of
Superannuation switching (Rev
2).
Legal Disclaimer: I do not hold a Financial Advisor’s
Licence and nothing in this article should be considered as
recommending any particular course of action to anyone else.
Download the Free Program that Applies these Rules
Examples of Switching from Nov 2009 to September 2011
Getting SMA Charts for Australian All Ordinaries
Table of Friday Checks and Switches
I perform the following checks each weekend using the Simple Moving Averages (SMA) values for previous Friday. The examples below will discuss SMA in more detail.
The discussion below talks about switching between 100% shares and 100% cash. Back testing has shown that in order for ProtectYourSuper to be effective, it needs to use a 'Cash' alternative that returns 5% or greater (per annum) when not in shares. A pure Cash Fund no longer meets the criteria, as today's interest rates are almost zero and will probably remain that way for some time to come. Prior to the current Coronavirus market crash, a Property Fund was used as the 'Cash' alternative and the pure Cash Fund was only used in cases of market turmoil, e.g. when the market fell by about 10% or more OR any time I felt I would sleep better at night if I was in 100% pure Cash.
As soon as the Friday's SMA(11) line
equals or falls below the SMA(33) line
OR
if the Friday's
SMA(33) line equals or falls below the SMA(99) line.
If I have any doubt about whether or not the line is on or below the other one, I assume the worst and switch to the safety of Cash.
Here I am more cautious because having my super is shares is much more risky then getting 4%+ in Cash. Before I will switch my super back to 100% Shares, All Three (3) the following conditions need to be met.
the Friday's SMA(11) has to be above the SMA(33) line, indicating a short term rising market
the Friday's SMA(33) has to be above the SMA(99) line, indicating the market is going up in the longer term
AND
Either the
last switch based on these conditions 1 and 2 must have made a
profit. (Based on the All Ordinaries closing prices on the Monday
following the switch decisions.)
Or the market has dropped
by more the 10%
Again, if I have any doubt about whether or not one of the above conditions has been met, then I assume the worst and leave all my super in the safety of Cash for another week.
If the last switch to Shares was not profitable, and the market has not dropped by more then 10%, then I stay in Cash and just note the closing index value on the next Monday and wait for next switch out signal. Again I note the closing index value on the following Monday and then see if the final index value was higher then the entry one. If the final index is higher then the entry index value is then I mark that switch as a success and condition 3) is satisfied for the next time conditions 1 and 2 tell me to switch to Shares. If, on the other hand, the final index value was lower, then I mark that switch as a failure and mark condition 3) as not being met for the next time conditions 1 and 2 tell me to switch to Shares.
Rev 2.2.1 changed Rule 3 to ignore the last switch profit/loss in cases where the market had fallen by more the 10%.
There is a program available for download here, (V2.1) which does these calculations. The program runs on Windows, Mac, Linux and Solaris. Pdf documentation for installing and running is also available here.
The charts and text below go through all the switching decisions between June 2010 and September 2011. This is what I used to do before I wrote the program to do it for me.
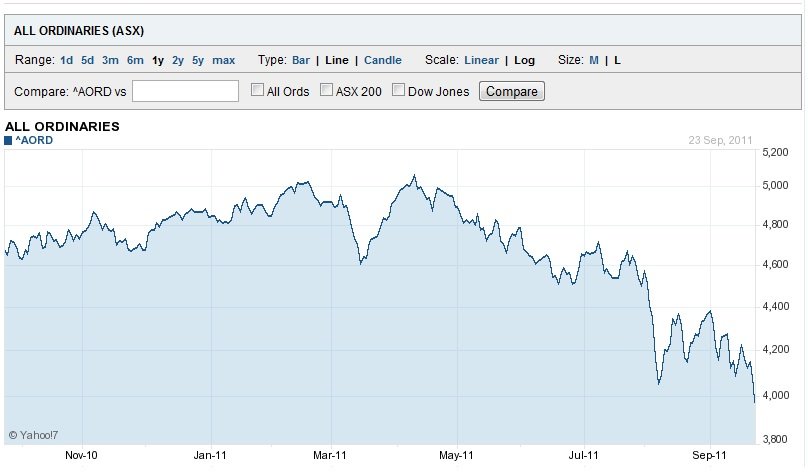
First lets look at the whole period with the two Simple Moving Averages (SMA) 15/45 and 30/90. Here I am using the internet charting provided by Yahoo as at 24th September 2011. From the http://au.finance.yahoo.com/ home page, choose [Investing] and Market Stats to bring up a page of Major Australia & NZ Indices from that page choose ^AORD chart link (right hand side of the page) to bring up a Basic Chart of one year the Australian All Ordinaries.
To add SMA lines, on the left hand side of the chart, click on Interactive to change the chart to
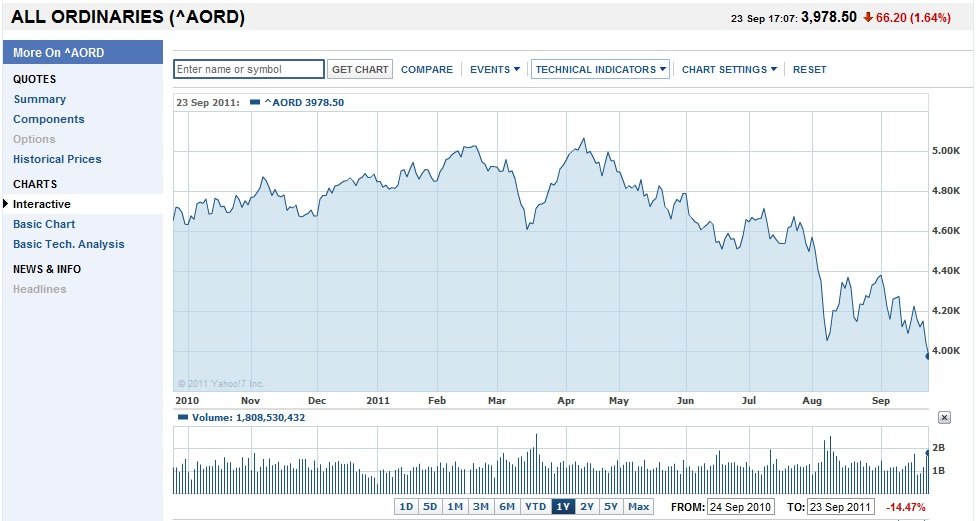
Then click on Technical Indicators in the top row and click on Simple Moving Averages and type in 15 and 45 for the first two.
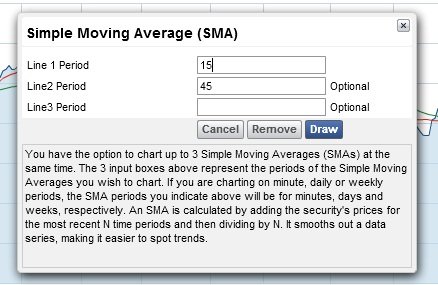
Then clicking Draw show the chart with these two SMA 15/45

Now that you can display the SMA lines on the chart, here are the charts for Nov 2009 to Feb 2010 for SMA 15/45 and 30/90
As shown on the main page there was short switch around Nov/Dec 2009. Looking at the chart from 20 Nov 2009 to 10 Feb 2010 (just type these dates into the From/To boxes at the bottom of the chart)
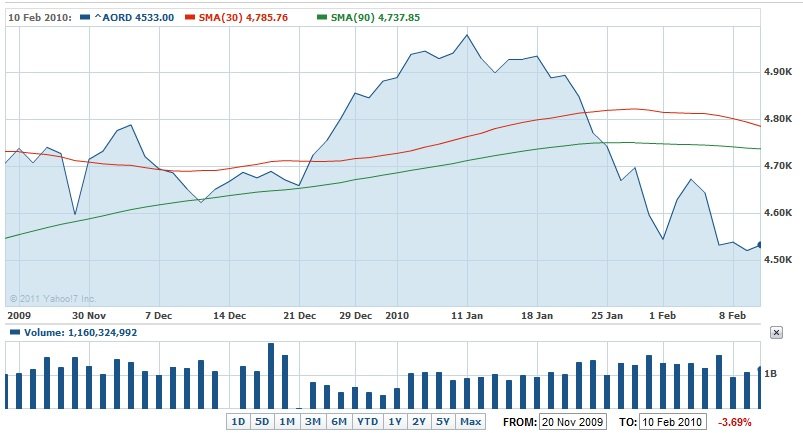
Setting
the SMA to 30/90 shows that over this period the 30 day SMA was
always above 90 day SMA so condition 2) of the rules was satisfied.
Condition 3) is satisfied because the last switch to Shares was profitable.
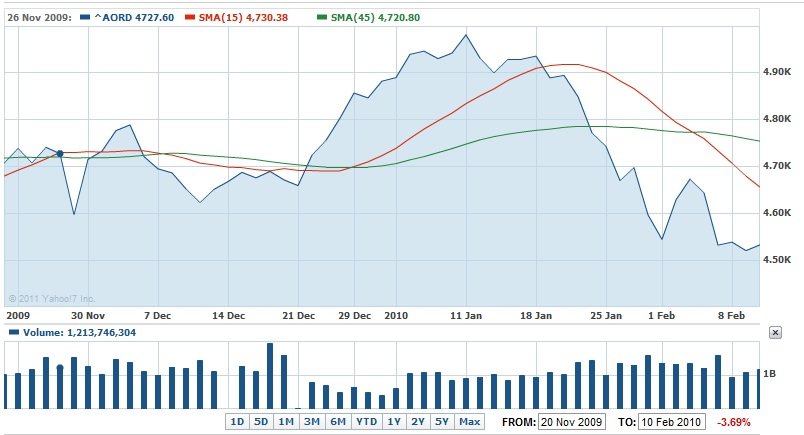
Setting the SMA to 15/45 shows that the lines crossover a number of times. So indicating possible switches into Shares based on rule 1) and out of Shares when the 15 SMA line falls below the 45 SMA line.
Check the SMA lines on the weekend for the last Friday shows that on Friday 26th Nov 2009 the 15 SMA had moved above the 45 SMA (the actual values are shown at the top of the Chart). So not all three conditions for switching to Shares are satisfied.
on the Friday the 15 SMA > 45 SMA
on the Friday the 30 SMA > 90 SMA
the last switch to Share returned a profit OR the market has fallen by more than 10%
So on that weekend I switched from Cash to 100% Shares. On the following Tuesday, 1st Dec 2009, I note the closing value of the All Ordinaries, 4733.10. I will use this value later to decide if this trade was profitable.
Checking the Friday SMA lines on each of the following weekends, I find that on Friday 11th Dec 2009 the 15 SMA has crossed below the 45 SMA. This is my signal to switch out of Shares and back to 100% Cash, which I do that weekend. On the following Tuesday, 15th Dec 2009, I note the All Ordinaries closing value of 4687.80. This is less than the entry value of 4733.10 so I mark this switch as NOT being profitable. This means the 3) condition for switching to shares is no longer satisfied. So I will not be switching to shares again until the this a profitable switch base in the 15/45, 30/90 SMAs.
On Friday 1st January 2010, I see that 15 SMA > 45 SMA and that 30 SMA is still greater then 90 SMA BUT since the last switch using these rules 1) and 2) was not profitable condition 3) is not satisfied so I do NOT switch to Shares but rather just not the All Ordinaries value on the following Tuesday, 5th Jan 2011 (4939.50) so that I can check later if this switch would have been profitable.
On Friday 5th Feb 2010, I see that 15 SMA has fallen below 45 SMA, so I note the All Ordinaries value on the following Tuesday, 9th Feb 2010, as 4520.70. This value is less then the 4939.50 entry value so I mark this switch as NOT profitable and continue to check the Friday charts for SMA 15/45 and 30/90 and the following Tuesday values of the All Ordinaries.
Ignoring those Fridays when there was no crossovers, the following table summarizes the results. The possible switch column is 'yes' if rules 1) and 2) are satisfied. i.e. if SMA 15>45 and SMA 30>90, but if the first column says the last switch to shares was not profitable then rule 3) is not satisfied and the switch is not actually made. Instead I just keep track of the All Ords. Close value of the following Tuesday to see if this would have been a profitable switch had it been made. Then when either SMA 15<45 OR SMA 30<90 I switch to Cash if I was in shares. In any case I note the All Ords. Close value of the following Tuesday to see if the switch would have been profitable had I actually made the switch into and out of shares. The dates I really switched into and out of shares are shown in bold below.
As shown in the table below the last two real switches into and
out of share have lost money, but I am still well ahead of the
Balance or Australian Share funds
(This table ignores market falls
of >10%)
|
Date |
SMA 15>45 |
SMA 30>90 |
Possible Switch |
Last Switch Profitable |
Switch to Shares |
All Ord |
Profitable Switch |
|
Friday 27th Nov 2009 |
Yes 15>45 |
Yes 30>90 |
yes |
Yes Last Switch Profitable |
Yes Switch to Shares |
4733.1 |
----- |
|
Friday 11th Dec 2009 |
No 15<45 |
-------- |
--------- |
-------- |
Switch to Cash |
4687.8 |
NO |
|
Thursday 31st Dec 2009 |
Yes 15>45 |
Yes 30>90 |
yes |
No Last Switch Not Profitable |
NO as last switch not Profitable |
4939.5 |
------ |
|
Friday 5th Feb 2010 |
No 15<45 |
---------- |
---------- |
--------- |
No already still in cash |
4520.7 |
NO |
|
Friday19th Feb 2010 |
No 15<45 |
No 30<90 |
no |
No Last Switch Not Profitable |
--------- |
-------- |
-------- |
|
Friday 12th Mar 2010 |
Yes 15>45 |
No 30<90 |
no |
No Last Switch Not Profitable |
--------- |
--------- |
--------- |
|
Friday 26th Mar 2010 |
Yes 15>45 |
Yes 30>90 |
yes |
No Last Switch Not Profitable |
NO as last switch not Profitable |
4926.8 |
--------- |
|
Friday 7th May 2010 |
No 15<45 |
---------- |
---------- |
---------- |
No already still in cash |
4573.2 |
NO |
|
Friday 21st May 2010 |
No 15<45 |
No 30<90 |
no |
No Last Switch Not Profitable |
--------- |
--------- |
--------- |
|
Friday 30th July 2010 |
Yes 15>45 |
No 30<90 |
no |
No Last Switch Not Profitable |
--------- |
--------- |
--------- |
|
Friday 3rd Sept 2010 |
Yes 15>45 |
Yes 30>90 |
yes |
No Last Switch Not Profitable |
NO as last switch not Profitable |
4613 |
--------- |
|
Friday 3rd Dec 2010 |
No 15<45 |
---------- |
|
----------- |
No already still in cash |
4816 |
Yes |
|
Friday 17th Dec 2010 |
Yes 15>45 |
Yes 30>90 |
yes |
Yes Last Switch Profitable |
Yes Switch to Shares |
4862.5 |
--------- |
|
Friday 11th Mar 2011 |
No 15<45 |
-------- |
|
-------- |
Switch to Cash |
4609.09
|
NO |
|
Friday 1st April 2011 |
-------- |
No 30<90 |
no |
-------- |
--------- |
--------- |
--------- |
|
Friday 15th April 2011 |
Yes 15>45 |
No 30<90 |
no |
-------- |
--------- |
--------- |
--------- |
|
Friday 29th April 2011 |
Yes 15>45 |
Yes 30>90 |
yes |
No Last Switch Not Profitable |
NO as last switch not Profitable |
4854.70
|
--------- |
|
Friday 20th May 2011 |
No 15<45 |
-------- |
|
-------- |
No already still in cash |
4708.30
|
NO |
|
Friday 27th May 2011 |
No 15<45 |
No 30<90 |
no |
-------- |
-------- |
-------- |
-------- |
|
Friday 21st Oct 2011 |
Yes 15>45 |
No 30<90 |
no |
-------- |
-------- |
-------- |
-------- |
|
Friday 18th Nov 2011 |
Yes 15>45 |
Yes 30>90 |
yes |
No Last Switch Not Profitable |
NO as last switch not Profitable |
4204.2 |
-------- |
|
Friday 2nd December 2011 |
No 15<45 |
Yes 30>90 |
no |
|
No already still in cash |
4321.6 |
YES |
|
|
|
|
|
Yes Last Switch Profitable |
|
|
|

Contact Forward Computing and Control by
©Copyright 1996-2020 Forward Computing and Control Pty. Ltd.
ACN 003 669 994